Build awesome dashboards with shiny
shinydashboardPlus 
I recently released shinydashboardPlus on CRAN. Therefore, some of the functions below are now included in the package. Find out more on github.
Introduction
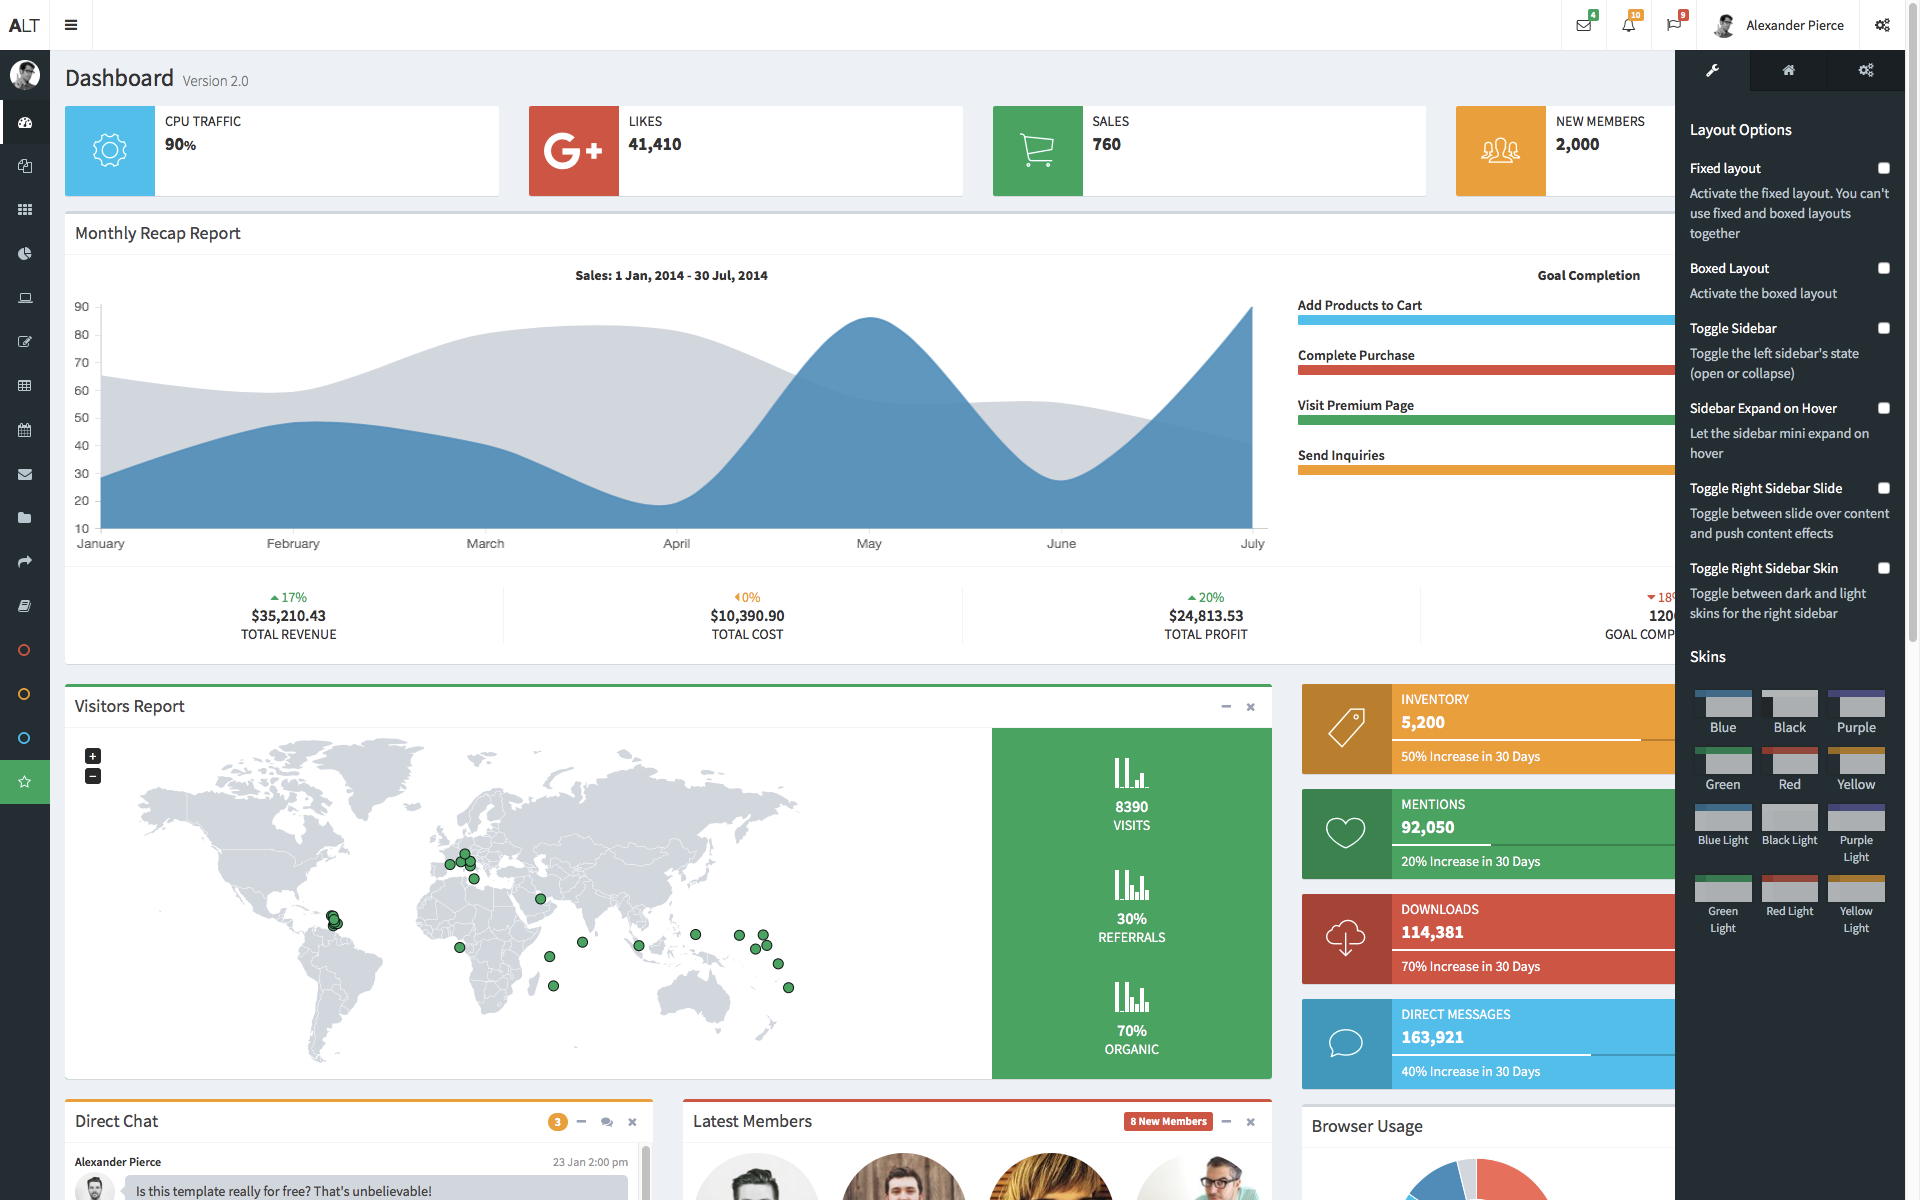
shinydashboard is without any doubt a great package. Even though built upon the famous free adminLTE2 dashboard template (boostrap 3), most of the dashboard I see almost look the same. In the shinydashboard package, some adminLTE2 components are not implemented such as the right sidebar, which can be extremely useful: contains input, parameters, … But everything you need is hidden under the hood, in the inst/AdminLTE folder (shinydashboard github).
In the following, I will show you how you could implement any of the adminLTE2 elements, when they are not already included in the shinydashboard package.
From R to HTML
Before going deeper in the adminLTE2 features, it is crucial to understand what does shiny!
You probably know that when you write a R shiny code, such as sliderInput, shiny will generate the corresponding HTML code, to be embeded into an html page. Let’s have a look at what happens:
library(shiny)
sliderInput("obs", "Number of observations:",
    min = 0, max = 1000, value = 500
  )
If you enter the previous code in the R console, you will see:
<div class="form-group shiny-input-container">
  <label class="control-label" for="obs">Number of observations:</label>
  <input class="js-range-slider" id="obs" data-min="0" data-max="1000" data-from="500" data-step="1" data-grid="true" data-grid-num="10" data-grid-snap="false" data-prettify-separator="," data-prettify-enabled="true" data-keyboard="true" data-keyboard-step="0.1" data-data-type="number"/>
</div>
Basically, all that you write in R will be translated in HTML:
library(shiny)
library(shinydashboard)
shinyApp(
  ui = dashboardPage(
    dashboardHeader(),
    dashboardSidebar(),
    dashboardBody(),
    title = "Dashboard example"
  ),
  server = function(input, output) { }
)
The UI code will be translated as shown below:
<body class="skin-blue" style="min-height: 611px;">
  <div class="wrapper">
    <header class="main-header">
      <span class="logo"></span>
      <nav class="navbar navbar-static-top" role="navigation">
        <span style="display:none;">
          <i class="fa fa-bars"></i>
        </span>
        <a href="#" class="sidebar-toggle" data-toggle="offcanvas" role="button">
          <span class="sr-only">Toggle navigation</span>
        </a>
        <div class="navbar-custom-menu">
          <ul class="nav navbar-nav"></ul>
        </div>
      </nav>
    </header>
    <aside class="main-sidebar" data-collapsed="false">
      <section class="sidebar"></section>
    </aside>
    <div class="content-wrapper">
      <section class="content"></section>
    </div>
  </div>
</body>
In pratice, this is not enough to build beautiful dashboard but it is still a good start. With this very simple technic, you will be able to generate any custom HTML. Moreover, if you are creating a shiny app with an HTML template, I find easier to create inputs (slider, checkboxes) writing them first in R. Once all your code is written, copy it in the R console to get the corresponding HTML, and include this HTML snippet in your full template. I personnaly, prefer seeing the code below that the corresponding HTML:
library(shinyWidgets)
prettyCheckboxGroup(
  inputId = "checkgroup2",
  label = "Click me!", thick = TRUE,
  choices = c("Click me !", "Me !", "Or me !"),
  animation = "pulse", status = "info"
)
This code is only 7 lines long and very clear. The HTML translation is widely less clear:
<div id="checkgroup2" class="form-group shiny-input-checkboxgroup shiny-input-container">
  <label class="control-label" for="checkgroup2">Click me!</label>
  <div class="shiny-options-group">
    <div style="height:7px;"></div>
    <div class="pretty p-default p-thick p-pulse">
      <input type="checkbox" name="checkgroup2" value="Click me !"/>
      <div class="state p-info">
        <label>
          <span>Click me !</span>
        </label>
      </div>
    </div>
    <div style="height:3px;"></div>
    <div class="pretty p-default p-thick p-pulse">
      <input type="checkbox" name="checkgroup2" value="Me !"/>
      <div class="state p-info">
        <label>
          <span>Me !</span>
        </label>
      </div>
    </div>
    <div style="height:3px;"></div>
    <div class="pretty p-default p-thick p-pulse">
      <input type="checkbox" name="checkgroup2" value="Or me !"/>
      <div class="state p-info">
        <label>
          <span>Or me !</span>
        </label>
      </div>
    </div>
    <div style="height:3px;"></div>
  </div>
</div>
What to do if you find an interesting HTML object (boostrap 3 compatible) that you want to integrate in your shiny app?
From HTML to R
Import HTML code into shiny
Before going further, make sure that the adminLTE2 source code is available somewhere on your computer. You can download it from here (version 2.4.2).
Let’s start with this very preliminary shinydashboard template:
library(shiny)
library(shinydashboard)
shinyApp(
  ui = dashboardPage(
    dashboardHeader(),
    dashboardSidebar(),
    dashboardBody(),
    title = "Dashboard example"
  ),
  server = function(input, output) { }
)
You noticed a timeline element that you really want to include in your shinydashboard.
According to the following screenshot, open the profile.html page with your favorite editor (notepad ++, Rstudio, Xcode, …).
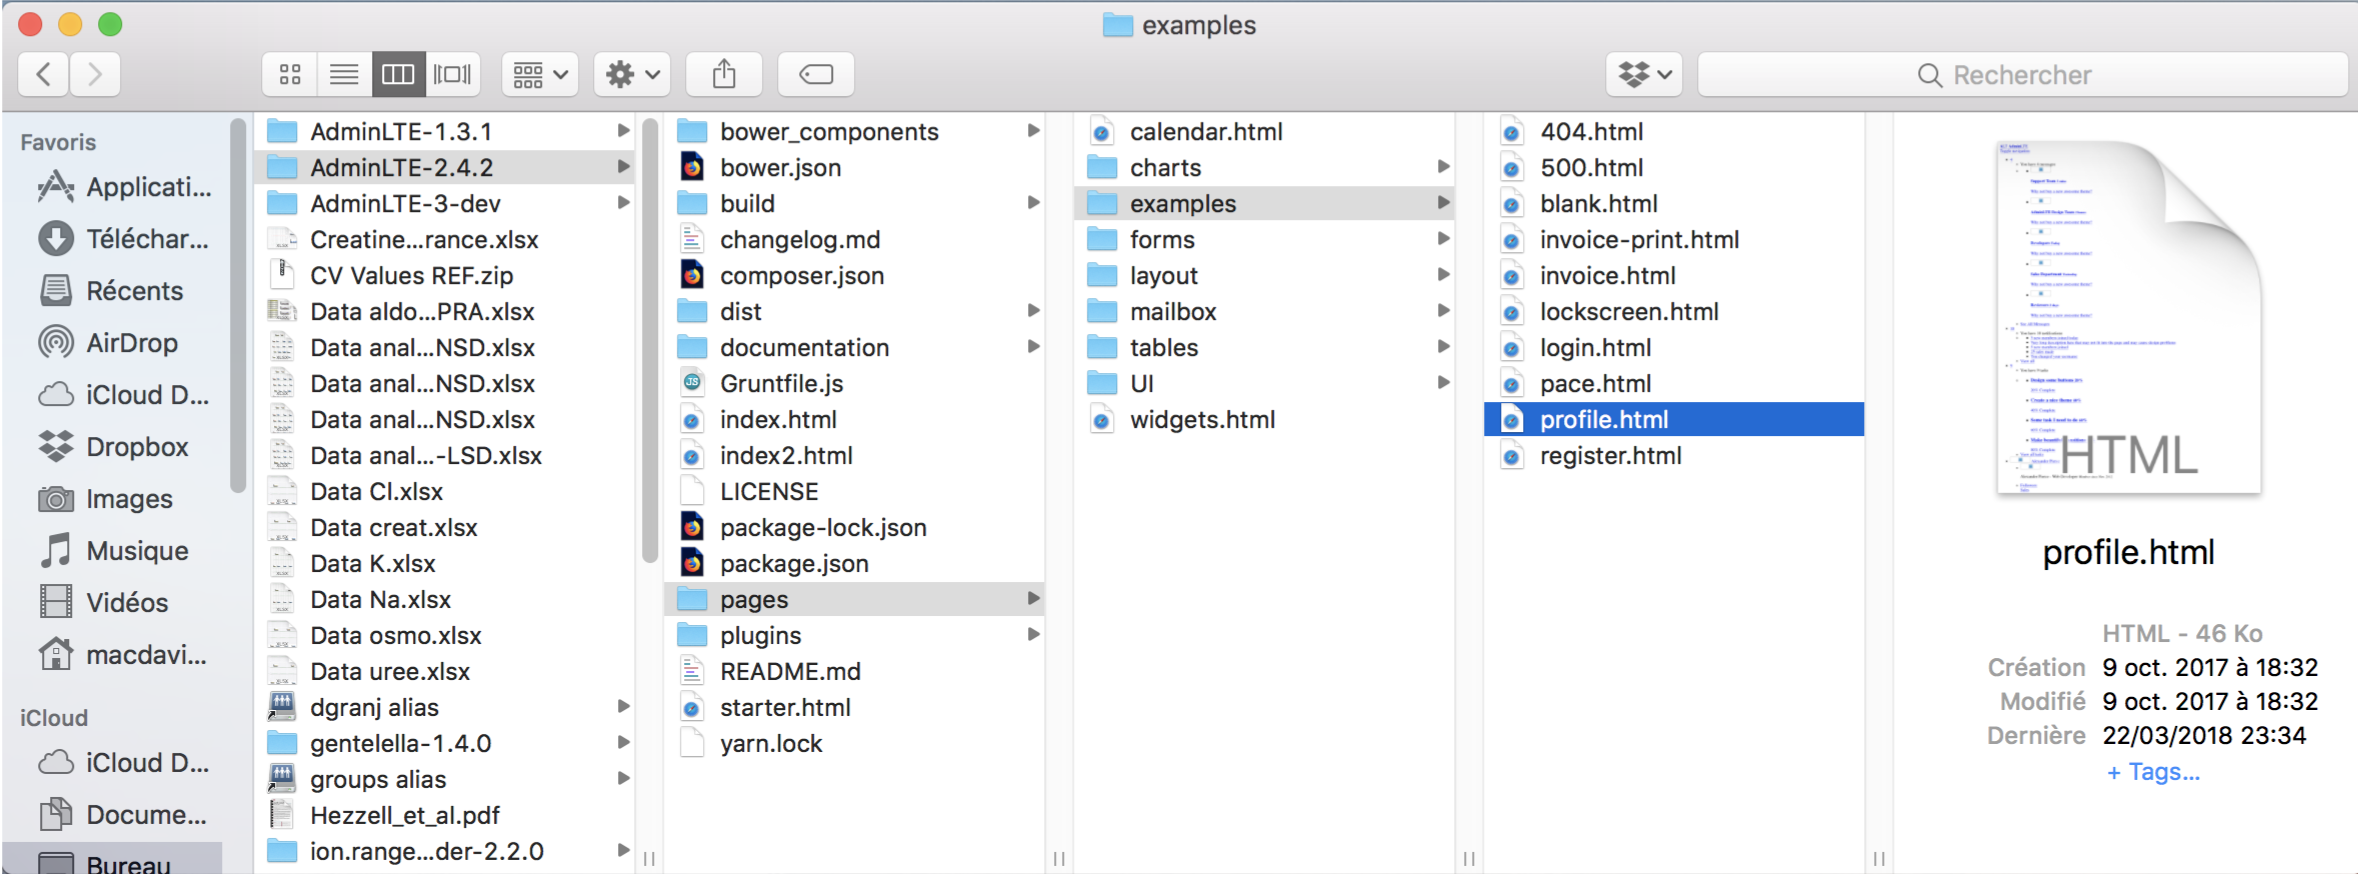
Go to find, type “The timeline” and copy the following code, which corresponds to the timeline object:
<div class="tab-pane" id="timeline">
                <!-- The timeline -->
                <ul class="timeline timeline-inverse">
                  <!-- timeline time label -->
                  <li class="time-label">
                        <span class="bg-red">
                          10 Feb. 2014
                        </span>
                  </li>
                  <!-- /.timeline-label -->
                  <!-- timeline item -->
                  <li>
                    <i class="fa fa-envelope bg-blue"></i>

                    <div class="timeline-item">
                      <span class="time"><i class="fa fa-clock-o"></i> 12:05</span>

                      <h3 class="timeline-header"><a href="#">Support Team</a> sent you an email</h3>

                      <div class="timeline-body">
                        Etsy doostang zoodles disqus groupon greplin oooj voxy zoodles,
                        weebly ning heekya handango imeem plugg dopplr jibjab, movity
                        jajah plickers sifteo edmodo ifttt zimbra. Babblely odeo kaboodle
                        quora plaxo ideeli hulu weebly balihoo...
                      </div>
                      <div class="timeline-footer">
                        <a class="btn btn-primary btn-xs">Read more</a>
                        <a class="btn btn-danger btn-xs">Delete</a>
                      </div>
                    </div>
                  </li>
                  <!-- END timeline item -->
                  <!-- timeline item -->
                  <li>
                    <i class="fa fa-user bg-aqua"></i>

                    <div class="timeline-item">
                      <span class="time"><i class="fa fa-clock-o"></i> 5 mins ago</span>

                      <h3 class="timeline-header no-border"><a href="#">Sarah Young</a> accepted your friend request
                      </h3>
                    </div>
                  </li>
                  <!-- END timeline item -->
                  <!-- timeline item -->
                  <li>
                    <i class="fa fa-comments bg-yellow"></i>

                    <div class="timeline-item">
                      <span class="time"><i class="fa fa-clock-o"></i> 27 mins ago</span>

                      <h3 class="timeline-header"><a href="#">Jay White</a> commented on your post</h3>

                      <div class="timeline-body">
                        Take me to your leader!
                        Switzerland is small and neutral!
                        We are more like Germany, ambitious and misunderstood!
                      </div>
                      <div class="timeline-footer">
                        <a class="btn btn-warning btn-flat btn-xs">View comment</a>
                      </div>
                    </div>
                  </li>
                  <!-- END timeline item -->
                  <!-- timeline time label -->
                  <li class="time-label">
                        <span class="bg-green">
                          3 Jan. 2014
                        </span>
                  </li>
                  <!-- /.timeline-label -->
                  <!-- timeline item -->
                  <li>
                    <i class="fa fa-camera bg-purple"></i>

                    <div class="timeline-item">
                      <span class="time"><i class="fa fa-clock-o"></i> 2 days ago</span>

                      <h3 class="timeline-header"><a href="#">Mina Lee</a> uploaded new photos</h3>

                      <div class="timeline-body">
                        <img src="http://placehold.it/150x100" alt="..." class="margin">
                        <img src="http://placehold.it/150x100" alt="..." class="margin">
                        <img src="http://placehold.it/150x100" alt="..." class="margin">
                        <img src="http://placehold.it/150x100" alt="..." class="margin">
                      </div>
                    </div>
                  </li>
                  <!-- END timeline item -->
                  <li>
                    <i class="fa fa-clock-o bg-gray"></i>
                  </li>
                </ul>
              </div>
To include raw HTML code in shiny, you can use the following (unsafe) method:
HTML(
  paste0('
  Your HTML code here
  ')
)
Let’s go back to our shinydashboard and include this HTML code in the body part:
library(shiny)
library(shinydashboard)
shinyApp(
  ui = dashboardPage(
    dashboardHeader(),
    dashboardSidebar(),
    dashboardBody(
      HTML(
        paste0('
          <div class="tab-pane" id="timeline">
                <!-- The timeline -->
                <ul class="timeline timeline-inverse">
                  <!-- timeline time label -->
                  <li class="time-label">
                        <span class="bg-red">
                          10 Feb. 2014
                        </span>
                  </li>
                  <!-- /.timeline-label -->
                  <!-- timeline item -->
                  <li>
                    <i class="fa fa-envelope bg-blue"></i>

                    <div class="timeline-item">
                      <span class="time"><i class="fa fa-clock-o"></i> 12:05</span>

                      <h3 class="timeline-header"><a href="#">Support Team</a> sent you an email</h3>

                      <div class="timeline-body">
                        Etsy doostang zoodles disqus groupon greplin oooj voxy zoodles,
                        weebly ning heekya handango imeem plugg dopplr jibjab, movity
                        jajah plickers sifteo edmodo ifttt zimbra. Babblely odeo kaboodle
                        quora plaxo ideeli hulu weebly balihoo...
                      </div>
                      <div class="timeline-footer">
                        <a class="btn btn-primary btn-xs">Read more</a>
                        <a class="btn btn-danger btn-xs">Delete</a>
                      </div>
                    </div>
                  </li>
                  <!-- END timeline item -->
                  <!-- timeline item -->
                  <li>
                    <i class="fa fa-user bg-aqua"></i>

                    <div class="timeline-item">
                      <span class="time"><i class="fa fa-clock-o"></i> 5 mins ago</span>

                      <h3 class="timeline-header no-border"><a href="#">Sarah Young</a> accepted your friend request
                      </h3>
                    </div>
                  </li>
                  <!-- END timeline item -->
                  <!-- timeline item -->
                  <li>
                    <i class="fa fa-comments bg-yellow"></i>

                    <div class="timeline-item">
                      <span class="time"><i class="fa fa-clock-o"></i> 27 mins ago</span>

                      <h3 class="timeline-header"><a href="#">Jay White</a> commented on your post</h3>

                      <div class="timeline-body">
                        Take me to your leader!
                        Switzerland is small and neutral!
                        We are more like Germany, ambitious and misunderstood!
                      </div>
                      <div class="timeline-footer">
                        <a class="btn btn-warning btn-flat btn-xs">View comment</a>
                      </div>
                    </div>
                  </li>
                  <!-- END timeline item -->
                  <!-- timeline time label -->
                  <li class="time-label">
                        <span class="bg-green">
                          3 Jan. 2014
                        </span>
                  </li>
                  <!-- /.timeline-label -->
                  <!-- timeline item -->
                  <li>
                    <i class="fa fa-camera bg-purple"></i>

                    <div class="timeline-item">
                      <span class="time"><i class="fa fa-clock-o"></i> 2 days ago</span>

                      <h3 class="timeline-header"><a href="#">Mina Lee</a> uploaded new photos</h3>

                      <div class="timeline-body">
                        <img src="http://placehold.it/150x100" alt="..." class="margin">
                        <img src="http://placehold.it/150x100" alt="..." class="margin">
                        <img src="http://placehold.it/150x100" alt="..." class="margin">
                        <img src="http://placehold.it/150x100" alt="..." class="margin">
                      </div>
                    </div>
                  </li>
                  <!-- END timeline item -->
                  <li>
                    <i class="fa fa-clock-o bg-gray"></i>
                  </li>
                </ul>
              </div>
        ')
      )
    ),
    title = "Dashboard example"
  ),
  server = function(input, output) { }
)
You should see something like that:

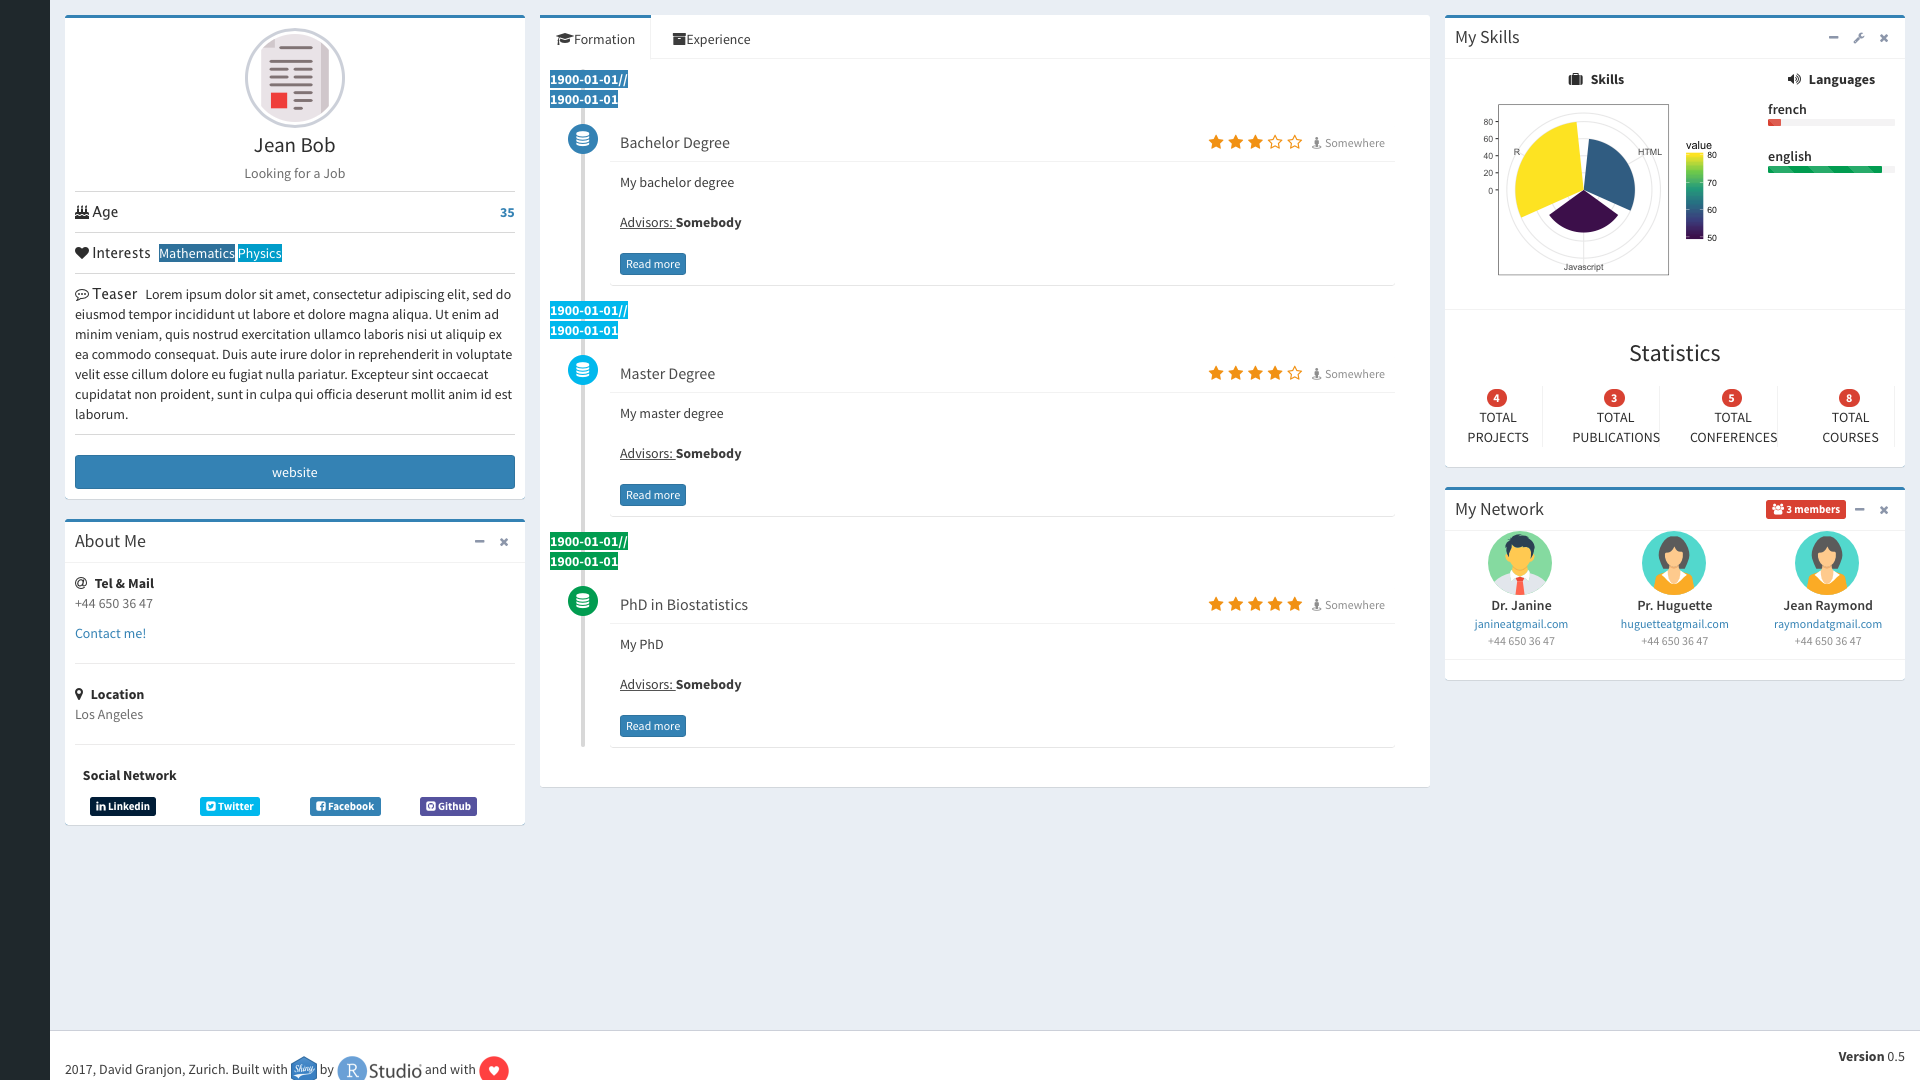
Congratulations!!! Actually and in my opinion, if you write a shiny app, it is more consistent to write everything in R and not mix HTML and R, or at least not too much. Below, I explain you how to translate this HTML code in R.
Convert this code from HTML to R
For this part, I will take the HTML code corresponding to a social box from adminLTE2.
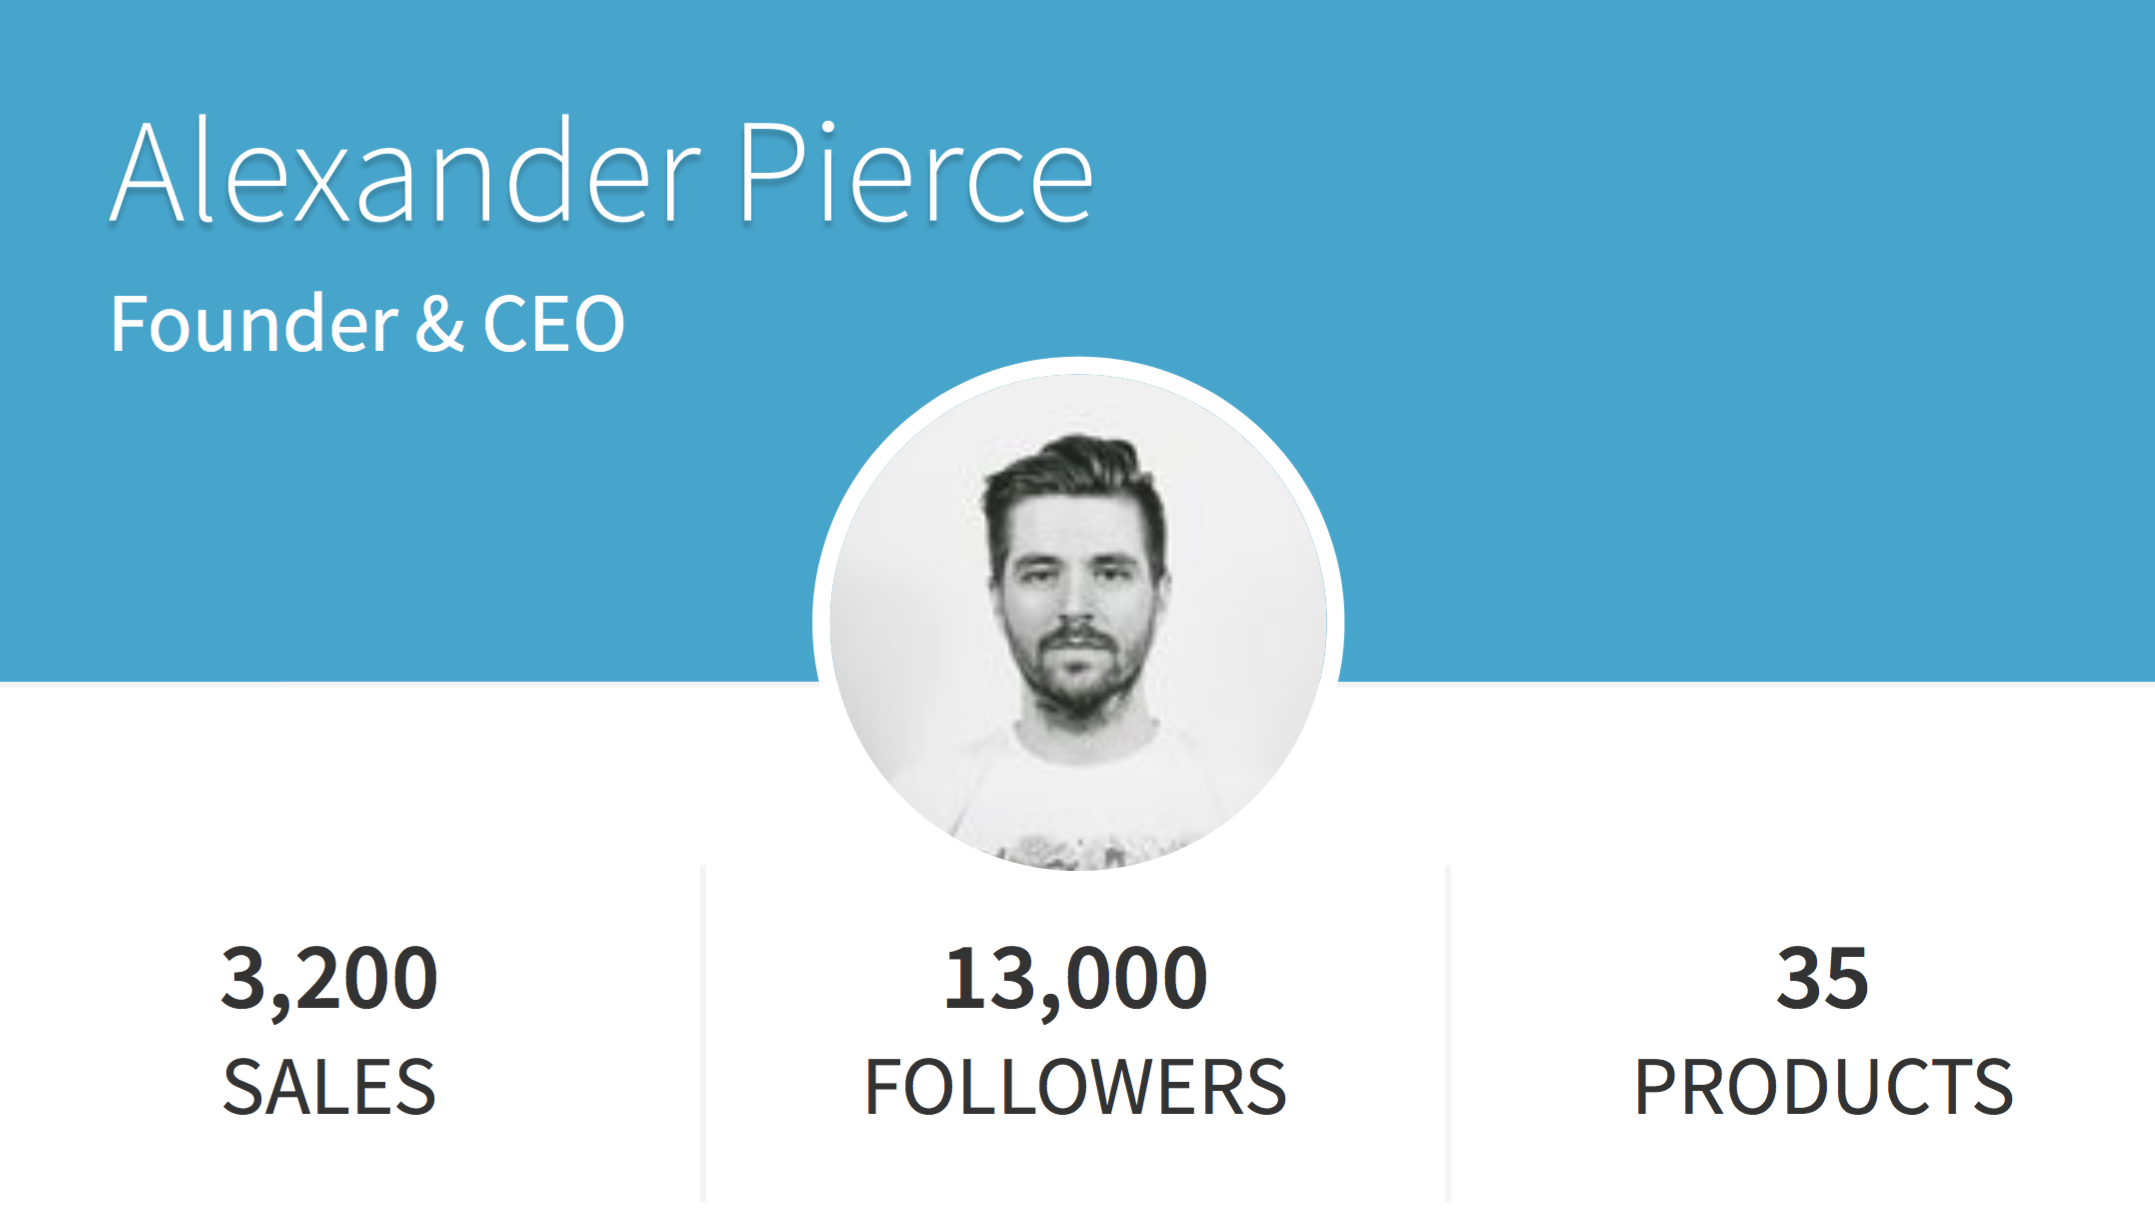
The associated HTML is located in the widgets.html file:
<!-- /.col -->
<div class="col-md-4">
<!-- Widget: user widget style 1 -->
<div class="box box-widget widget-user">
<!-- Add the bg color to the header using any of the bg-* classes -->
<div class="widget-user-header bg-aqua-active">
<h3 class="widget-user-username">Alexander Pierce</h3>
<h5 class="widget-user-desc">Founder & CEO</h5>
</div>
<div class="widget-user-image">
<img class="img-circle" src="../dist/img/user1-128x128.jpg" alt="User Avatar">
</div>
<div class="box-footer">
<div class="row">
<div class="col-sm-4 border-right">
<div class="description-block">
<h5 class="description-header">3,200</h5>
<span class="description-text">SALES</span>
</div>
<!-- /.description-block -->
</div>
<!-- /.col -->
<div class="col-sm-4 border-right">
<div class="description-block">
<h5 class="description-header">13,000</h5>
<span class="description-text">FOLLOWERS</span>
</div>
<!-- /.description-block -->
</div>
<!-- /.col -->
<div class="col-sm-4">
<div class="description-block">
<h5 class="description-header">35</h5>
<span class="description-text">PRODUCTS</span>
</div>
<!-- /.description-block -->
</div>
<!-- /.col -->
</div>
<!-- /.row -->
</div>
</div>
<!-- /.widget-user -->
</div>
<!-- /.col -->To convert it into R, we will use the tags function from the htmltools package (shiny also includes it).
Each HTML5 tag will be preceded by tags such as tags$h5("an example") or
tags$div(class = "col-sm-4"). Anyway,
if you enter tags$ in the console, a list of all valid tags will appear (and I have
no idea of the total number).
The converted code will look like that:
# col
tags$div(
  class = "col-md-4",
  # Widget: user widget style 1
  tags$div(
    class = "box box-widget widget-user",
    # Add the bg color to the header using any of the bg-* classes
    ## Box Header ##
    tags$div(
      class = "widget-user-header bg-aqua-active",
      tags$h3(class = "widget-user-username", "Alexander Pierce"),
      tags$h5(class = "widget-user-desc", "Founder at CEO")
    )
    ## Box Image ##
    tags$div(
      class = "widget-user-image",
      tags$img(class = "img-circle", src = "", alt = "User Avatar")
    ),
    ## Box Footer ##
    tags$div(
      class = "box-footer",
      tags$div(
        class = "row",
        # first column
        tags$div(
          class = "col-sm-4 border-right",
          tags$div(
            class = "description-block",
            tags$h5(class = "description-header", "3200"),
            tags$span(class = "description-text", "SALES")
          )
        ),
        # second column
        tags$div(
          class = "col-sm-4 border-right",
          tags$div(
            class = "description-block",
            tags$h5(class = "description-header", "13000"),
            tags$span(class = "description-text", "FOLLOWERS")
          )
        ),
        # third column
        tags$div(
          class = "col-sm-4 border-right",
          tags$div(
            class = "description-block",
            tags$h5(class = "description-header", "35"),
            tags$span(class = "description-text", "PRODUCTS")
          )
        )
      )
    )
  )
)
Having a try with our own basic shinydashboard template:
library(shiny)
library(shinydashboard)
shinyApp(
ui = dashboardPage(
dashboardHeader(),
dashboardSidebar(),
dashboardBody(
# col
tags$div(
class = "col-md-4",
# Widget: user widget style 1
tags$div(
class = "box box-widget widget-user",
# Add the bg color to the header using any of the bg-* classes
## Box Header ##
tags$div(
class = "widget-user-header bg-aqua-active",
tags$h3(class = "widget-user-username", "Alexander Pierce"),
tags$h5(class = "widget-user-desc", "Founder at CEO")
),
## Box Image ##
tags$div(
class = "widget-user-image",
tags$img(class = "img-circle", src = "", alt = "User Avatar")
),
## Box Footer ##
tags$div(
class = "box-footer",
tags$div(
class = "row",
# first column
tags$div(
class = "col-sm-4 border-right",
tags$div(
class = "description-block",
tags$h5(class = "description-header", "3200"),
tags$span(class = "description-text", "SALES")
)
),
# second column
tags$div(
class = "col-sm-4 border-right",
tags$div(
class = "description-block",
tags$h5(class = "description-header", "13000"),
tags$span(class = "description-text", "FOLLOWERS")
)
),
# third column
tags$div(
class = "col-sm-4 border-right",
tags$div(
class = "description-block",
tags$h5(class = "description-header", "35"),
tags$span(class = "description-text", "PRODUCTS")
)
)
)
)
)
)
),
title = "Dashboard example"
),
server = function(input, output) { }
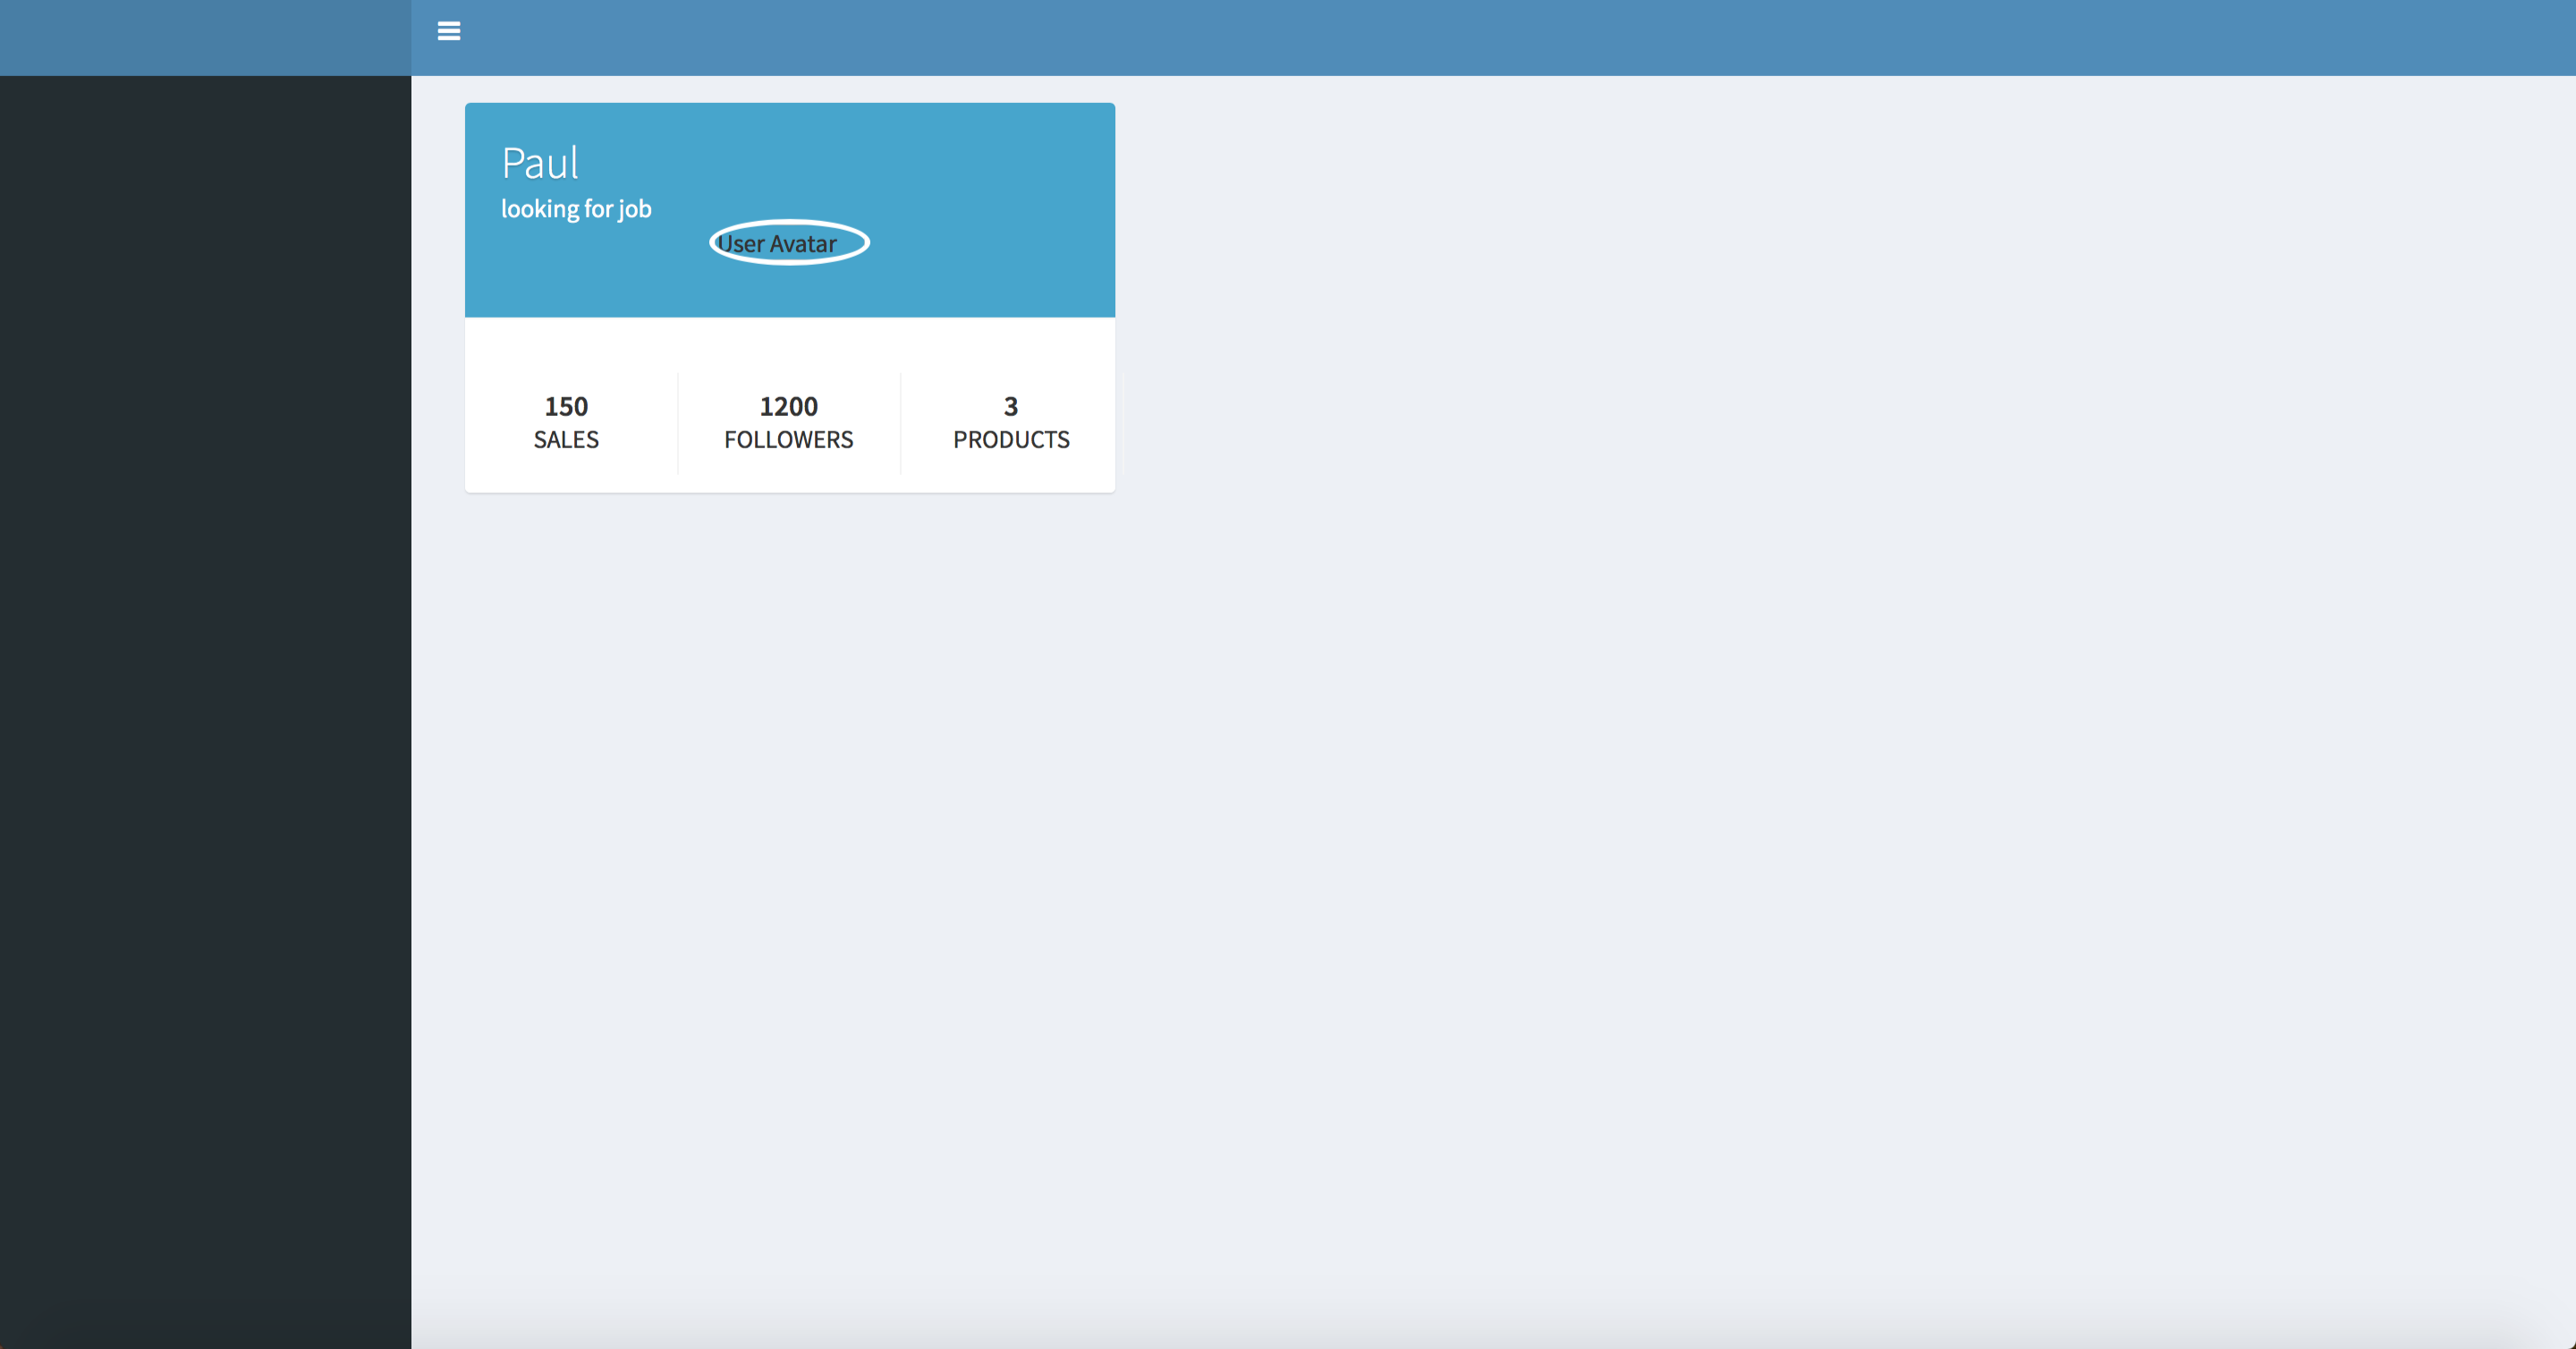
)The profile image is not displayed because I did not provide any source
tags$img(class = "img-circle", src = "", alt = "User Avatar"). Up to you to pass
your own image that should by in the /www directory of your application.
It would be better if you wrapped this custom R code in your own function like that:
my_tiny_socialbox <- function(username = "Paul", userposition = "looking for job",
                              sales = NULL, followers = NULL, products = NULL) {

  # check some inputs
  stopifnot(is.numeric(sales))
  stopifnot(is.numeric(followers))
  stopifnot(is.numeric(products))

  # the box tags
  withTags(
    # col
    div(
      class = "col-md-4",
      # Widget: user widget style 1
      div(
        class = "box box-widget widget-user",
        # Add the bg color to the header using any of the bg-* classes
        ## Box Header ##
        div(
          class = "widget-user-header bg-aqua-active",
          h3(class = "widget-user-username", username),
          h5(class = "widget-user-desc", userposition)
        ),
        ## Box Image ##
        div(
          class = "widget-user-image",
          img(class = "img-circle", src = "", alt = "User Avatar")
        ),
        ## Box Footer ##
        div(
          class = "box-footer",
          div(
            class = "row",
            # first column
            div(
              class = "col-sm-4 border-right",
              div(
                class = "description-block",
                h5(class = "description-header", sales),
                span(class = "description-text", "SALES")
              )
            ),
            # second column
            div(
              class = "col-sm-4 border-right",
              div(
                class = "description-block",
                h5(class = "description-header", followers),
                span(class = "description-text", "FOLLOWERS")
              )
            ),
            # third column
            div(
              class = "col-sm-4 border-right",
              div(
                class = "description-block",
                h5(class = "description-header", products),
                span(class = "description-text", "PRODUCTS")
              )
            )
          )
        )
      )
    )
  )
}
where you would have some fields such as username, userposition, sales, followers and products.
I use the withTags function that enables me to remove tags$ (lazyness :)).
# create your custom box
my_tiny_socialbox <- function(username = "Paul", userposition = "looking for job",
                              sales = NULL, followers = NULL, products = NULL) {

  # check some inputs
  stopifnot(is.numeric(sales))
  stopifnot(is.numeric(followers))
  stopifnot(is.numeric(products))

  # the box tags
  withTags(
    # col
    div(
      class = "col-md-4",
      # Widget: user widget style 1
      div(
        class = "box box-widget widget-user",
        # Add the bg color to the header using any of the bg-* classes
        ## Box Header ##
        div(
          class = "widget-user-header bg-aqua-active",
          h3(class = "widget-user-username", username),
          h5(class = "widget-user-desc", userposition)
        ),
        ## Box Image ##
        div(
          class = "widget-user-image",
          img(class = "img-circle", src = "", alt = "User Avatar")
        ),
        ## Box Footer ##
        div(
          class = "box-footer",
          div(
            class = "row",
            # first column
            div(
              class = "col-sm-4 border-right",
              div(
                class = "description-block",
                h5(class = "description-header", sales),
                span(class = "description-text", "SALES")
              )
            ),
            # second column
            div(
              class = "col-sm-4 border-right",
              div(
                class = "description-block",
                h5(class = "description-header", followers),
                span(class = "description-text", "FOLLOWERS")
              )
            ),
            # third column
            div(
              class = "col-sm-4 border-right",
              div(
                class = "description-block",
                h5(class = "description-header", products),
                span(class = "description-text", "PRODUCTS")
              )
            )
          )
        )
      )
    )
  )
}

# launch the dashboard with our simple custom function
library(shiny)
library(shinydashboard)
shinyApp(
  ui = dashboardPage(
    dashboardHeader(),
    dashboardSidebar(),
    dashboardBody(
      my_tiny_socialbox(username = "Paul", userposition = "looking for job",
                        sales = 150, followers = 1200, products = 3)
    ),
    title = "Dashboard example"
  ),
  server = function(input, output) { }
)
Congratulations!
From now, you should be able to integrate any boostrap 3 compatible objects in your shinydashboards.
A better example of what you could achieve is here
Customize shinydashboard elements
In this part, I explain how you could improve the box function
that is already available shinydashboard::box.
Let’s analyse this function:
box <- function (..., title = NULL, footer = NULL, status = NULL, solidHeader = FALSE,
background = NULL, width = 6, height = NULL, collapsible = FALSE,
collapsed = FALSE)
{
  boxClass <- "box"
  if (solidHeader || !is.null(background)) {
  boxClass <- paste(boxClass, "box-solid")
  }
  if (!is.null(status)) {
  validateStatus(status)
  boxClass <- paste0(boxClass, " box-", status)
  }
  if (collapsible && collapsed) {
  boxClass <- paste(boxClass, "collapsed-box")
  }
  if (!is.null(background)) {
  validateColor(background)
  boxClass <- paste0(boxClass, " bg-", background)
  }
  style <- NULL
  if (!is.null(height)) {
  style <- paste0("height: ", validateCssUnit(height))
  }
  titleTag <- NULL
  if (!is.null(title)) {
  titleTag <- h3(class = "box-title", title)
  }
  collapseTag <- NULL
  if (collapsible) {
  buttonStatus <- status %OR% "default"
  collapseIcon <- if (collapsed)
  "plus"
  else "minus"
  collapseTag <- div(class = "box-tools pull-right", tags$button(class = paste0("btn btn-box-tool"),
  `data-widget` = "collapse", shiny::icon(collapseIcon)))
  }
  headerTag <- NULL
  if (!is.null(titleTag) || !is.null(collapseTag)) {
  headerTag <- div(class = "box-header", titleTag, collapseTag)
  }
  div(class = if (!is.null(width))
  paste0("col-sm-", width), div(class = boxClass, style = if (!is.null(style))
  style, headerTag, div(class = "box-body", ...), if (!is.null(footer))
  div(class = "box-footer", footer)))
}
The basic css class is “box” and stored in the variable boxClass. If you enter other parameters such as the box status (choose among primary, success, info, warning, danger), the boxClass will be updated so that it could be “box-primary” if the status is primary. You can control other parameters such as the collapsible state, the background color, …
When I started shiny app development, I noticed that the boxes were not possible to close, which can be useful sometimes. From now, let’s make it closable! Everything you need is already in adminLTE2, we just have to reorder things properly. The box toolbox, which contains the collapse and close button as well as other elements such as badges, is implemented as follow in HTML:
<div class="box-tools pull-right">
                <span data-toggle="tooltip" title="3 New Messages" class="badge bg-light-blue">3</span>
                <button type="button" class="btn btn-box-tool" data-widget="collapse"><i class="fa fa-minus"></i>
                </button>
                <button type="button" class="btn btn-box-tool" data-widget="remove"><i class="fa fa-times"></i></button>
              </div>
Everything is embeded in a “box-tools pull-right” class. What we actually need is this part:
<button type="button" class="btn btn-box-tool" data-widget="remove"><i class="fa fa-times"></i></button>The box function from shinydashboard package already contains the collapsible button (if the collapsible argument is TRUE).
collapseTag <- NULL
  if (collapsible) {
    buttonStatus <- status %OR% "default"
    collapseIcon <- if (collapsed)
      "plus"
    else "minus"
    collapseTag <- div(
      class = "box-tools pull-right",
      tags$button(
        class = paste0("btn btn-box-tool"),
        `data-widget` = "collapse", shiny::icon(collapseIcon)
      )
    )
  }
As in the adminLTE2 HTML snippet, you recognize class = "box-tools pull-right"
and tags$button(class = paste0("btn btn-box-tool"), `data-widget` = "collapse", shiny::icon(collapseIcon)).
We are just going to add a similar implementation for the closable state (copy this
code just after the collapseTag):
# make our box closable
  closableTag <- NULL
  if (closable) {
    closableTag <- tags$button(
      class = "btn btn-box-tool",
      `data-widget` = "remove",
      type = "button",
      tags$i(shiny::icon("times"))
    )
    # add the new tag to the collapse tag
    collapseTag <- tagAppendChild(collapseTag, closableTag)
  }
Notice that I used tagAppendChild(collapseTag, closableTag) to update the collapseTag
by adding it the closableTag. Since it could be confusing to add
the closable tag to the collapsible one, it would even be better if you created a boxToolTag
for which you would add collapseTag and closableTag such as:
boxToolTag <- NULL
if (collapsible || closable) {
  boxToolTag <- div(class = "box-tools pull-right")
}

collapseTag <- NULL
  if (collapsible) {
    buttonStatus <- status %OR% "default"
    collapseIcon <- if (collapsed)
      "plus"
    else "minus"
    collapseTag <- tags$button(
        class = paste0("btn btn-box-tool"),
        `data-widget` = "collapse", shiny::icon(collapseIcon)
      )
    )
  }

  # make our box closable
  closableTag <- NULL
  if (closable) {
    closableTag <- tags$button(
      class = "btn btn-box-tool",
      `data-widget` = "remove",
      type = "button",
      tags$i(shiny::icon("times"))
    )
  }

boxToolTag <- tagAppendChildren(boxToolTag, collapseTag, closableTag)
Finally, do not forget to replace collapseTag by boxToolTag in the box headerTag
headerTag <- div(class = "box-header", titleTag, collapseTag) (the final code is at the end
of this section). Besides, you should add the closable argument to the argument list
(closable = TRUE by default).
I have a good (or bad) new for you: this was just the warm-up! What do you think about adding tags to the boxToolTag?
This is very simple: the HTML code is here:
<span class="label label-danger">UI Design</span>which gives in R:
# we first quickly create the label function
dashboardLabel <- function(..., status = "primary") {
  stopifnot(!is.null(status))
  validateStatus(status)
  tags$span(
    class = paste0("label", " label-", status),
    ...
  )
}

# add it after closableTag
labelTag <- dashboardLabel("My Label", status = label_status)

boxToolTag <- tagAppendChildren(boxToolTag, labelTag, collapseTag, closableTag)
You should also add the label_status argument to the argument list of the box function!
The final code is here:
library(shiny)
library(shinydashboard)
##########
#
# useful functions
#
##########
validateColor <- function(color) {
if (color %in% validColors) {
return(TRUE)
}
stop("Invalid color: ", color, ". Valid colors are: ",
paste(validColors, collapse = ", "), ".")
}
validStatuses <- c("primary", "success", "info", "warning", "danger")
validateStatus <- function(status) {
if (status %in% validStatuses) {
return(TRUE)
}
stop("Invalid status: ", status, ". Valid statuses are: ",
paste(validStatuses, collapse = ", "), ".")
}
"%OR%" <- function(a, b) if (!is.null(a)) a else b
# we first quickly create the label function
dashboardLabel <- function(..., status = "primary") {
stopifnot(!is.null(status))
validateStatus(status)
tags$span(
class = paste0("label", " label-", status),
...
)
}
##########
#
# box code
#
##########
box <- function (..., title = NULL, footer = NULL, status = NULL, solidHeader = FALSE,
background = NULL, width = 6, height = NULL, collapsible = FALSE,
collapsed = FALSE, closable = TRUE, label_status = "primary")
{
boxClass <- "box"
if (solidHeader || !is.null(background)) {
boxClass <- paste(boxClass, "box-solid")
}
if (!is.null(status)) {
validateStatus(status)
boxClass <- paste0(boxClass, " box-", status)
}
if (collapsible && collapsed) {
boxClass <- paste(boxClass, "collapsed-box")
}
if (!is.null(background)) {
validateColor(background)
boxClass <- paste0(boxClass, " bg-", background)
}
style <- NULL
if (!is.null(height)) {
style <- paste0("height: ", validateCssUnit(height))
}
titleTag <- NULL
if (!is.null(title)) {
titleTag <- h3(class = "box-title", title)
}
# the new boxtool section
boxToolTag <- NULL
if (collapsible || closable) {
boxToolTag <- div(class = "box-tools pull-right")
}
collapseTag <- NULL
if (collapsible) {
buttonStatus <- status %OR% "default"
collapseIcon <- if (collapsed)
"plus"
else "minus"
collapseTag <- tags$button(
class = paste0("btn btn-box-tool"),
`data-widget` = "collapse", shiny::icon(collapseIcon)
)
}
closableTag <- NULL
if (closable) {
closableTag <- tags$button(
class = "btn btn-box-tool",
`data-widget` = "remove",
type = "button",
tags$i(shiny::icon("times"))
)
}
labelTag <- dashboardLabel("My Label", status = label_status)
# update boxToolTag
boxToolTag <- tagAppendChildren(boxToolTag, labelTag, collapseTag, closableTag)
headerTag <- NULL
if (!is.null(titleTag) || !is.null(collapseTag)) {
# replace by boxToolTag
headerTag <- div(class = "box-header", titleTag, boxToolTag)
}
div(class = if (!is.null(width))
paste0("col-sm-", width), div(class = boxClass, style = if (!is.null(style))
style, headerTag, div(class = "box-body", ...), if (!is.null(footer))
div(class = "box-footer", footer)))
}
##########
#
# test our box
#
##########
shinyApp(
ui = dashboardPage(
dashboardHeader(),
dashboardSidebar(),
dashboardBody(
fluidRow(
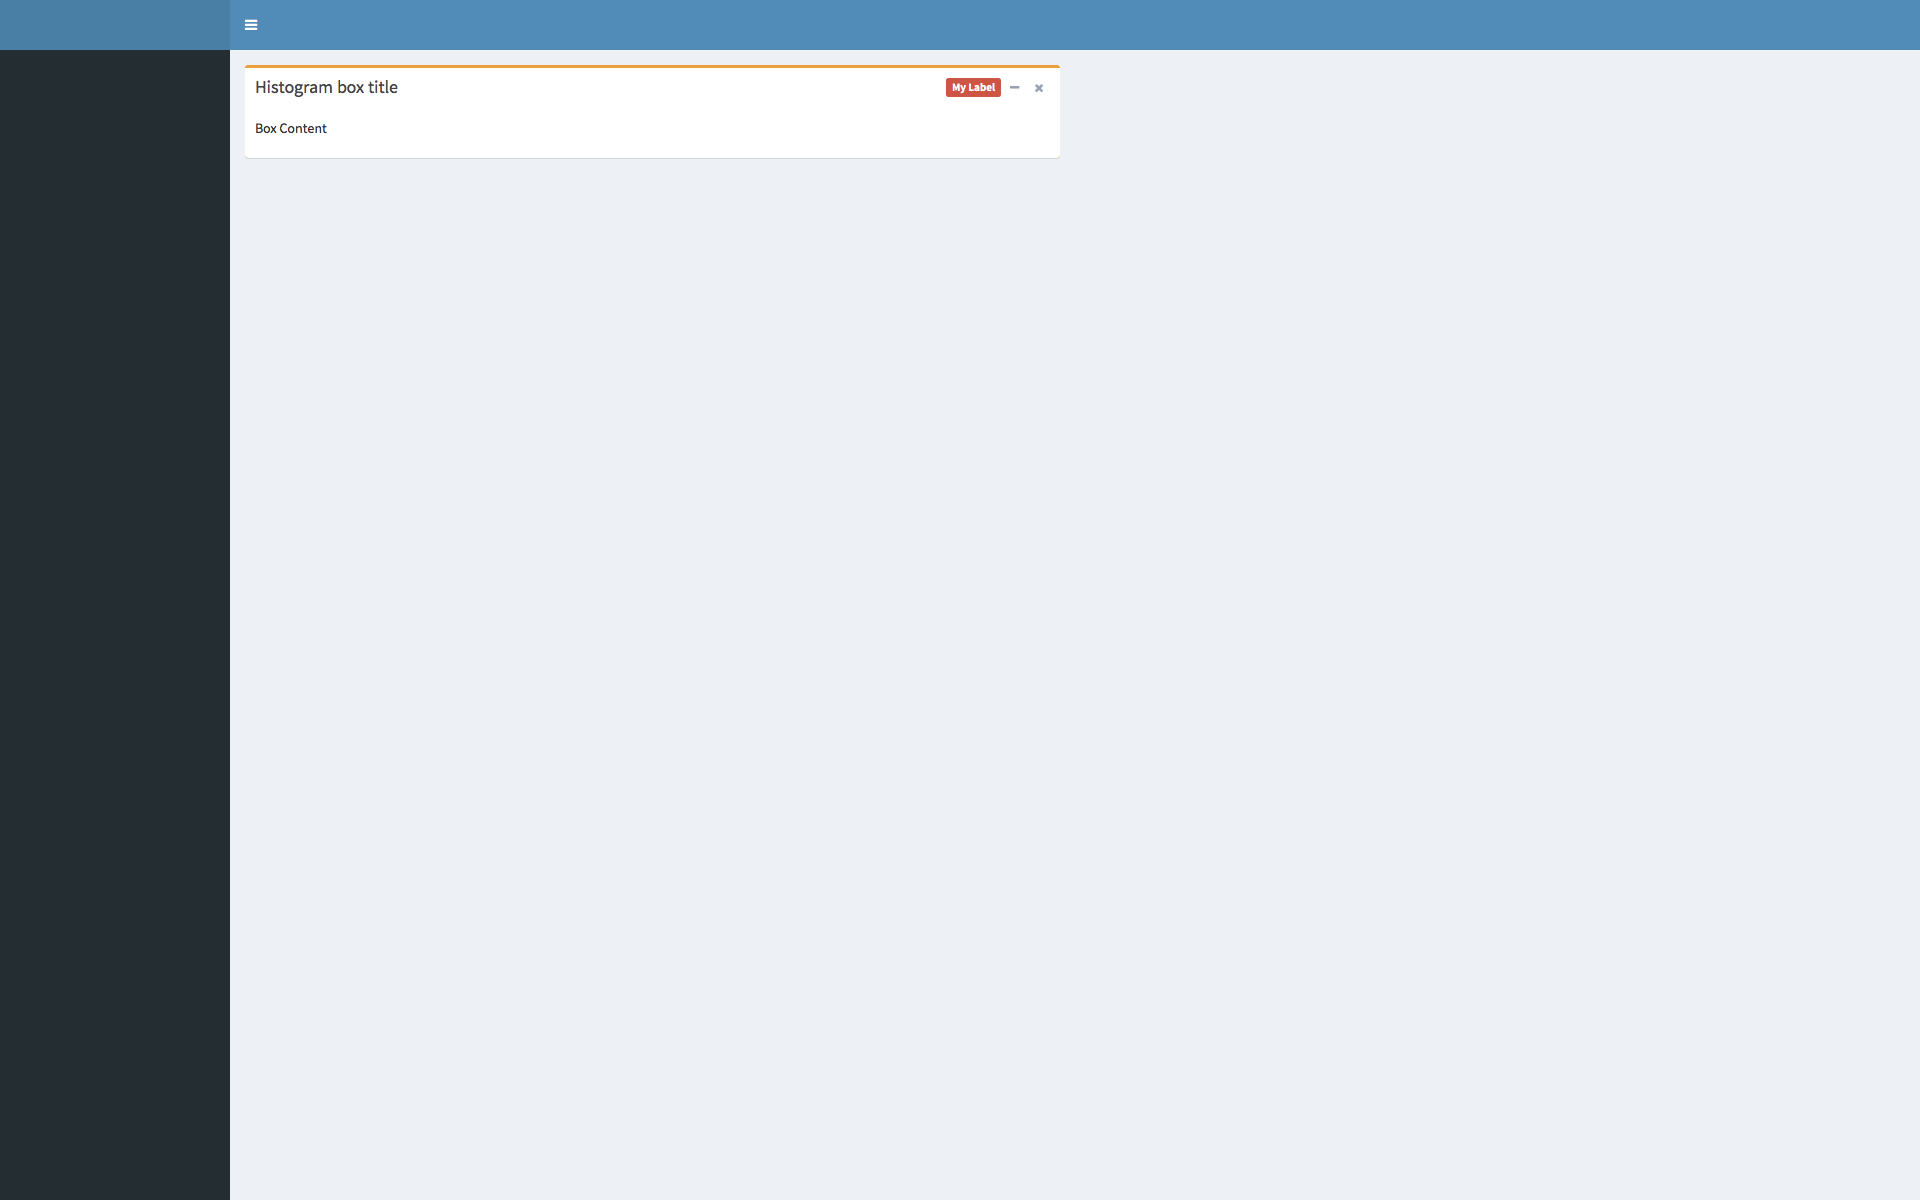
box(title = "Histogram box title", closable = TRUE, label_status = "danger",
status = "warning", solidHeader = FALSE, collapsible = TRUE,
p("Box Content")
)
)
)
),
server = function(input, output) {}
)Here is the result.
I wish you a nice customization :)
Some improved version of shinydashboard
To finish this tutorial, I have some suggestions to radically pimp your dashboard design.
gentelella dashboard
A version very similar to adminLTE2. By chance, a shiny implementation is available here, developed by Mark Edmonson.
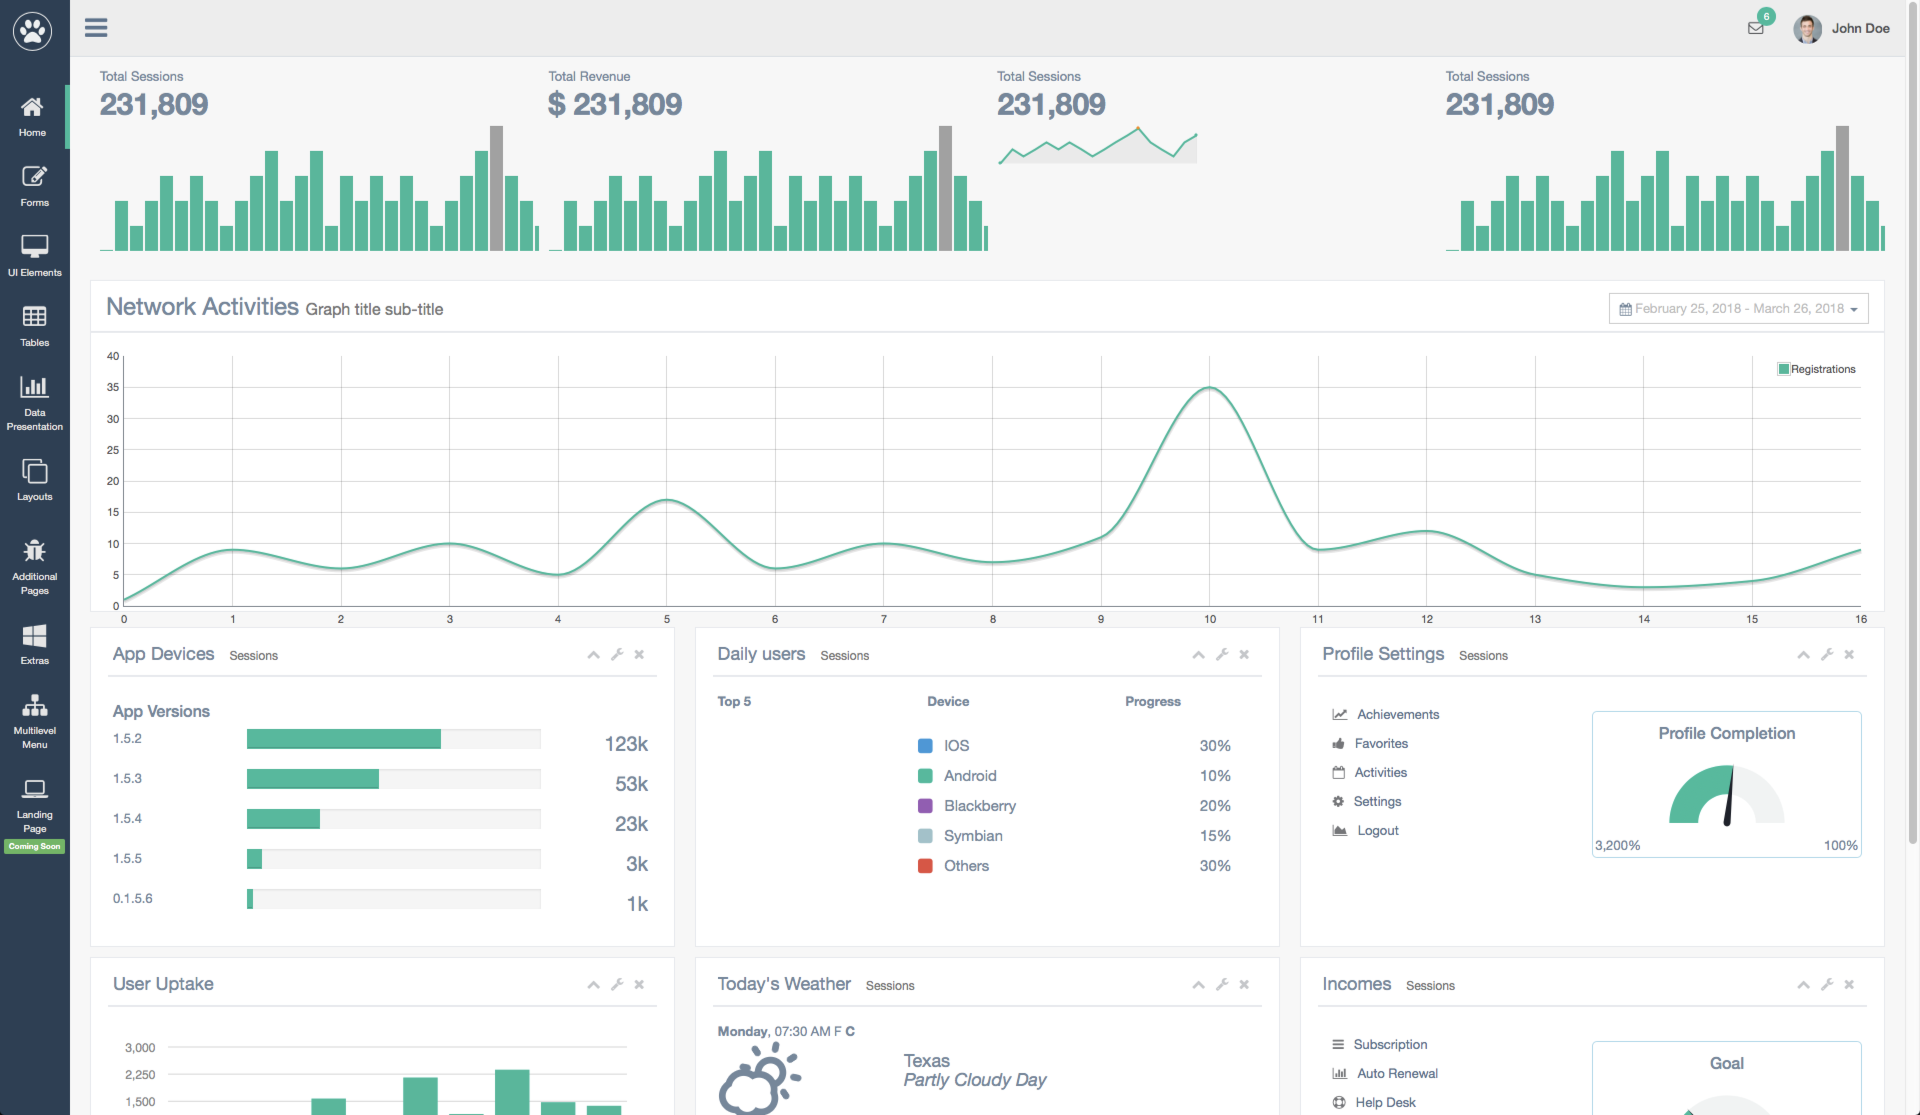
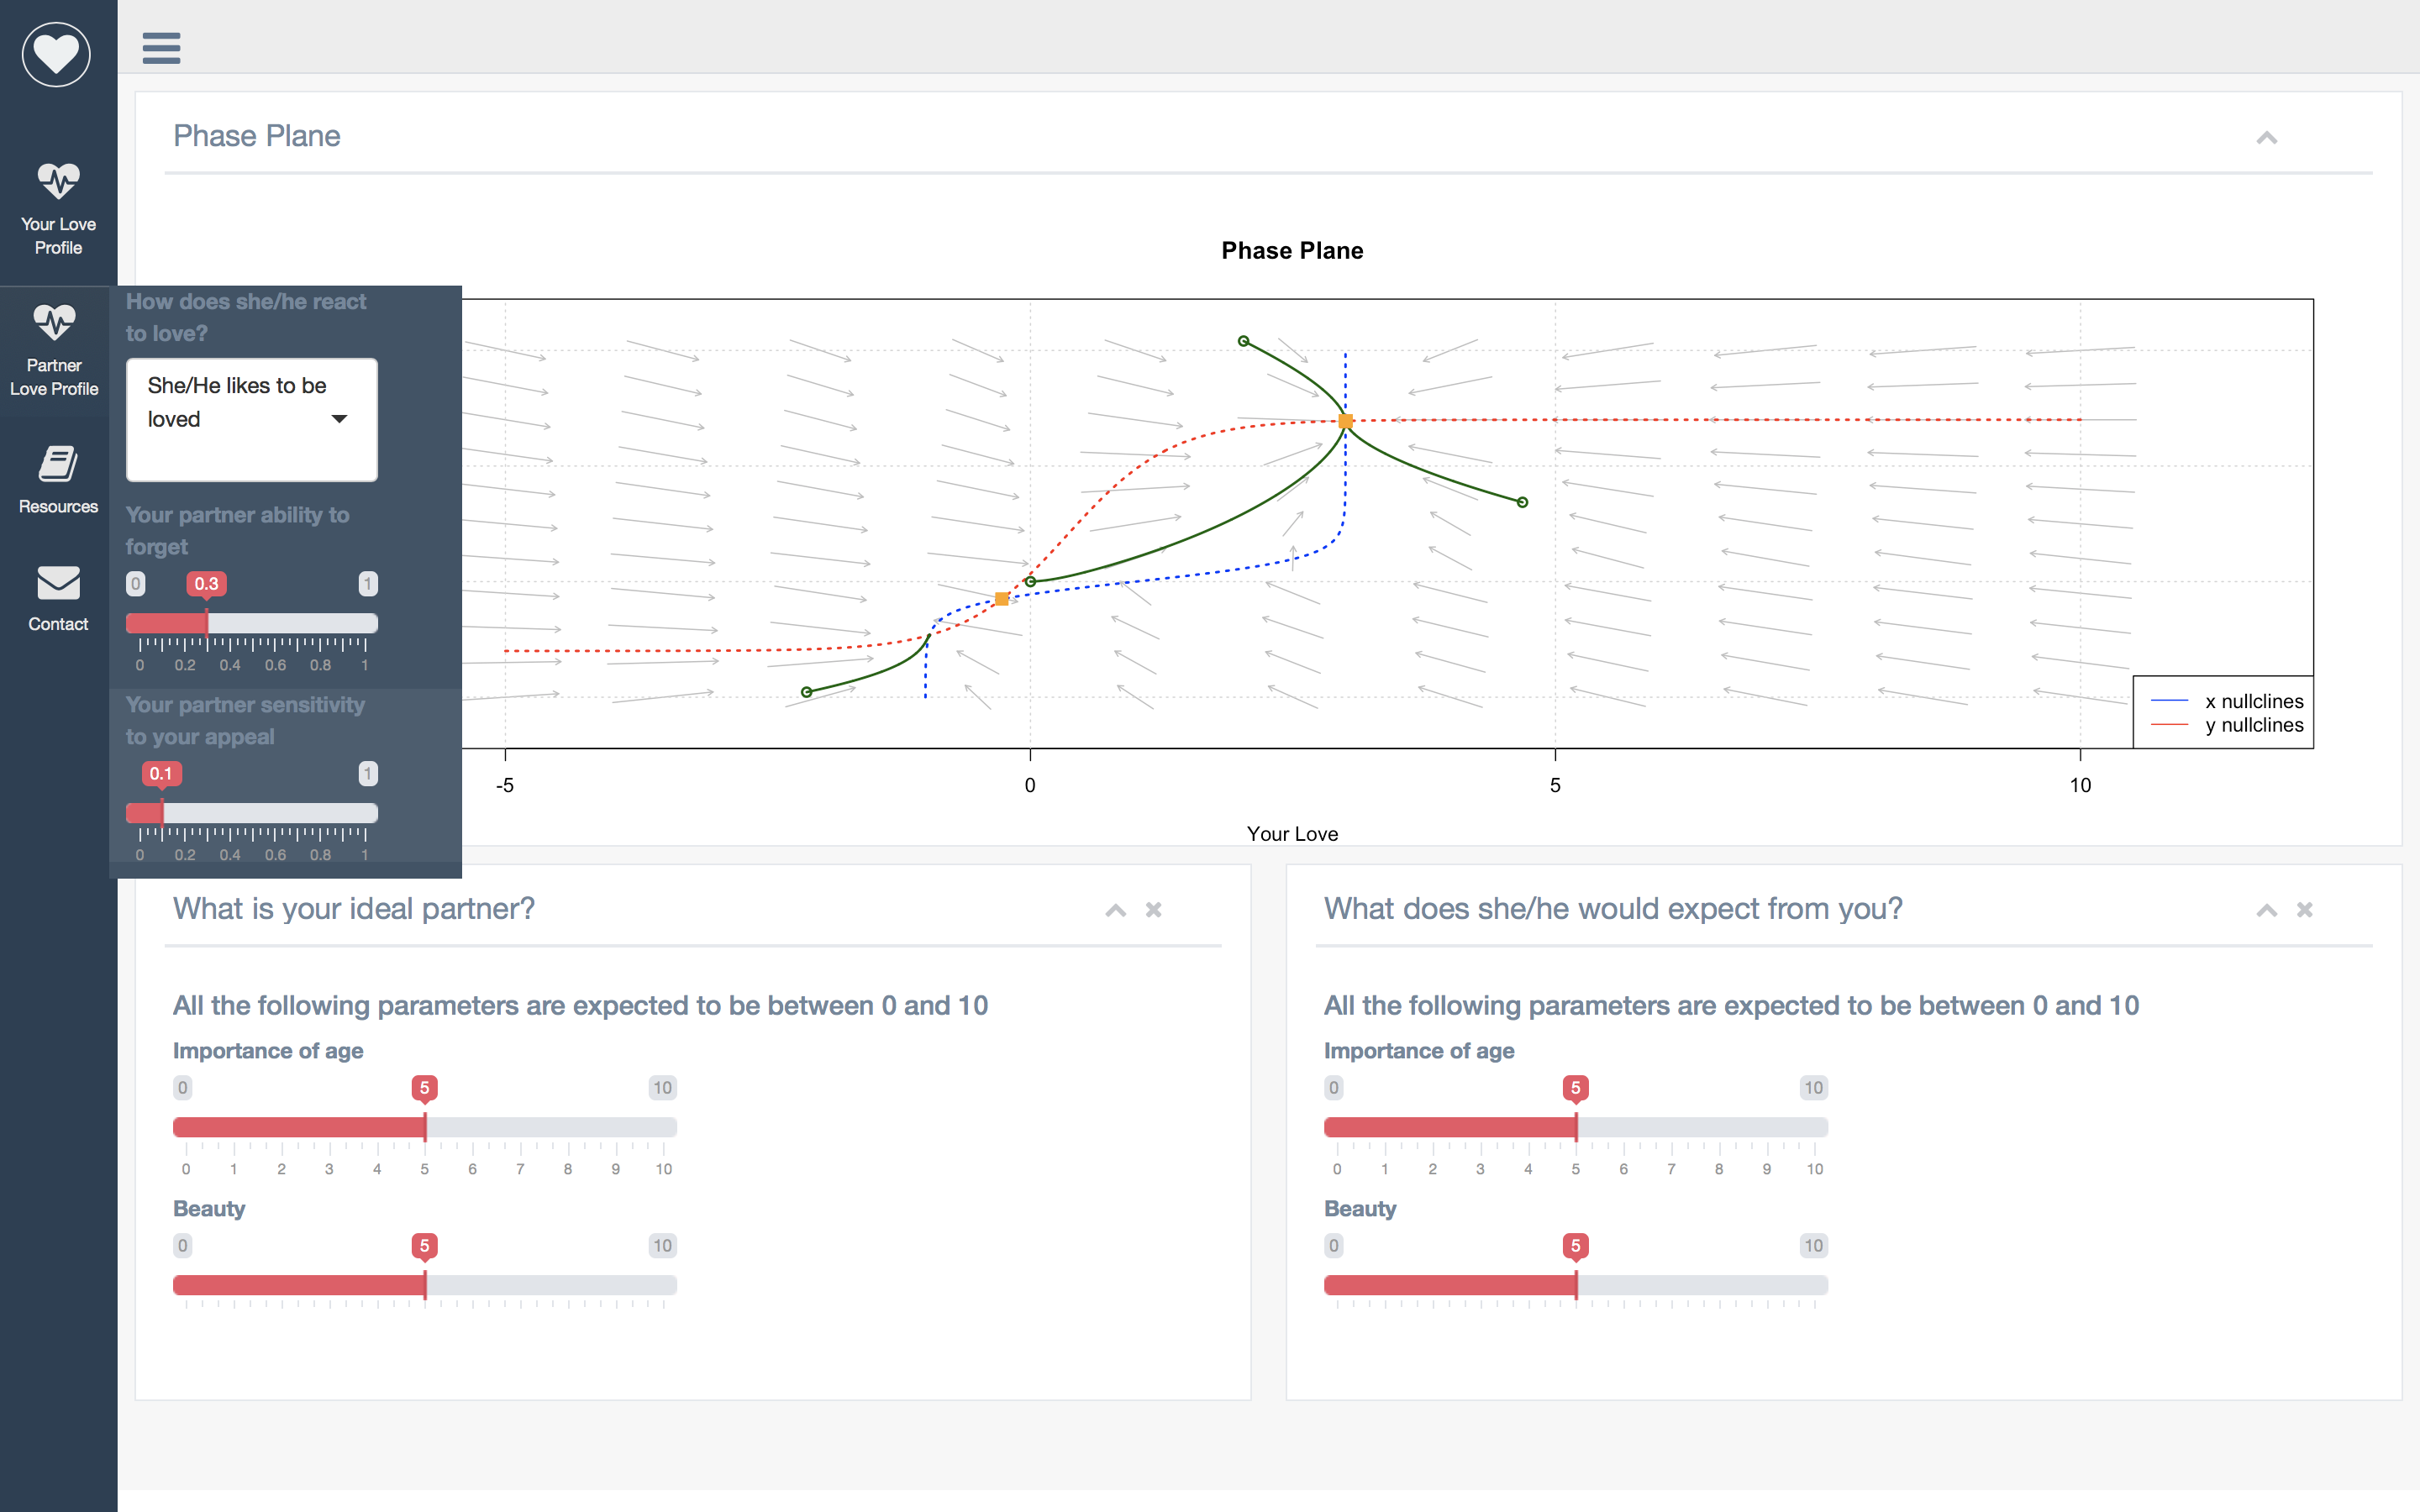
This template looks really promising! Below a demonstration of an app I am currently developing for an external project (it is unfortunately in French).
Semantic dashboards
Recently released on CRAN by the Appsilon
data science group, this upcoming package
seems a very interesting alternative to shinydashboard. It relies on the semantic UI
library, for wich shiny.semantic is also available.
Semantic dashboard looks very
clear but terribly efficient. What I really enjoy is that you only need to change
library(shinydashboard) to library(semantic.dashboard) in order to convert any shinydashboard to the semantic design. Besides, you can add any of the
semantic themes (make either light or dark dashboard), which you cannot do
with shinydashboard. Amazing!!!
library(shiny)
library(shiny.semantic)
library(semantic.dashboard)
library(plotly)
library(DT)

ui <- dashboardPage(
  dashboardHeader(dropdownMenuOutput("dropdown"),
                  dropdownMenu(type = "notifications",
                               taskItem("Project progress...", 50.777, color = "red")),
                  dropdownMenu(icon = uiicon("red warning sign"),
                               notificationItem("This is an important notification!", color = "red"))),
  dashboardSidebar(side = "left",
                   sidebarMenu(
                     menuItem(tabName = "plot_tab", text = "My plot", icon = icon("home")),
                     menuItem(tabName = "table_tab", text = "My table", icon = icon("smile")))),
  dashboardBody(
    tabItems(
      tabItem(tabName = "plot_tab",
              fluidRow(
                valueBox("Unread Mail", 44, icon("mail"), color = "blue", width = 5)),
              fluidRow(
                box(title = "Sample box", color = "blue", width = 11,
                    selectInput(inputId =  "variable1", choices = names(mtcars),
                                label = "Select first variable", selected = "mpg"),
                    selectInput(inputId =  "variable2", choices = names(mtcars),
                                label = "Select second variable", selected = "cyl"),
                    plotlyOutput("mtcars_plot")),
                tabBox(title = "Sample box", color = "blue", width = 5,
                       collapsible = FALSE,
                       tabs = list(
                         list(menu = "First Tab", content = "Some text..."),
                         list(menu = "Second Tab", content = plotlyOutput("mtcars_plot2"))
                       )))),
      tabItem(tabName = "table_tab",
              fluidRow(
                valueBox("Unread Mail", 144, icon("mail"), color = "blue", width = 6, size = "small"),
                valueBox("Spam", 20, icon("mail"), color = "red", width = 5, size = "small"),
                valueBox("Readed Mail", 666, icon("mail"), color = "green", width = 5, size = "small")
              ),
              fluidRow(
                box(title = "Classic box", color = "blue", ribbon = FALSE,
                    title_side = "top left", width = 14,
                    tags$div(
                      dataTableOutput("mtcars_table")
                      , style = paste0("color:", semantic_palette[["blue"]], ";"))
                ))))
  ), theme = "slate"
)

server <- function(input, output) {

  output$mtcars_plot <- renderPlotly(plot_ly(mtcars, x = ~ mtcars[ , input$variable1],
                                             y = ~ mtcars[ , input$variable2],
                                             type = "scatter", mode = "markers")
  )
  output$mtcars_plot2 <- renderPlotly(plot_ly(mtcars, x = ~ mtcars[ , input$variable1],
                                              y = ~ mtcars[ , input$variable2],
                                              type = "scatter", mode = "markers"))

  output$mtcars_table <- renderDataTable(mtcars, options = list(dom = 't'))

  output$dropdown <- renderDropdownMenu({
    dropdownMenu(messageItem("User", "Test message", color = "teal", style = "min-width: 200px"),
                 messageItem("Users", "Test message", color = "teal", icon = "users"),
                 messageItem("See this", "Another test", icon = "warning", color = "red"))
  })
}

shinyApp(ui, server)
The result below ;)

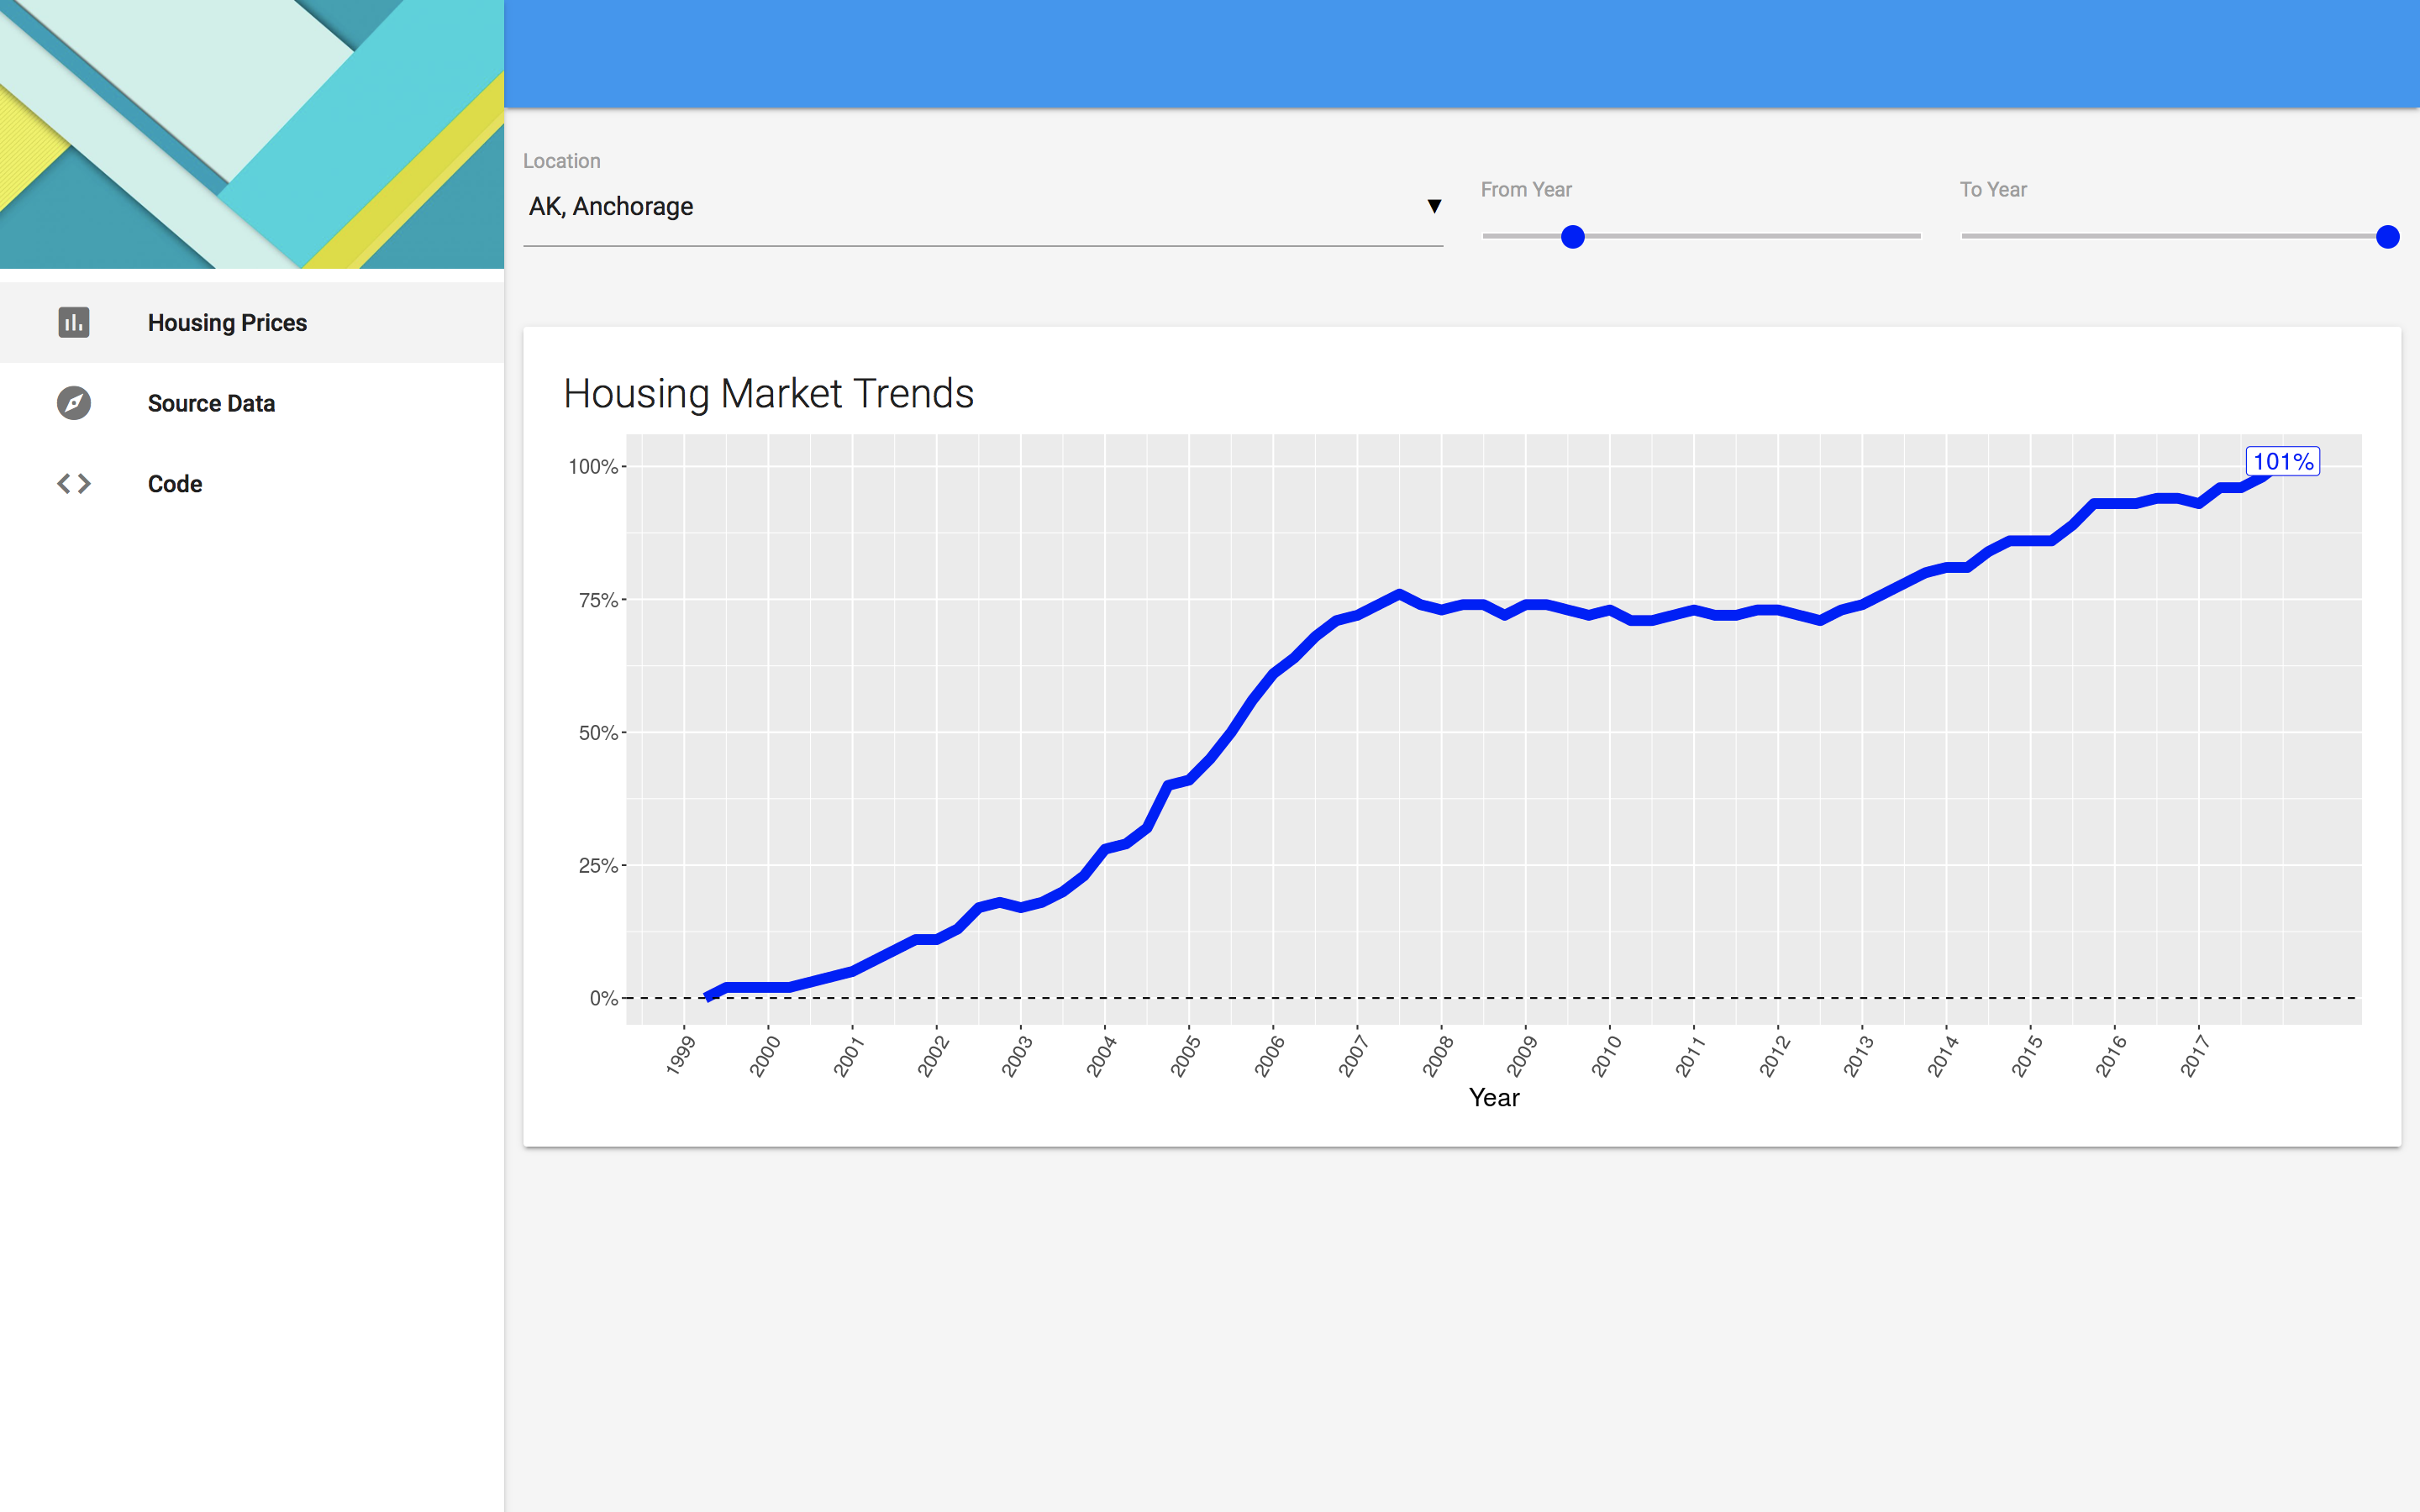
Material dashboards
Material design to build shiny dashboards. Download shinymaterial from here. A dashboard example is available here.
More Updates Coming soon